US Economic Performance by State
Wealth varies widely across the 50 states. The map below demonstrates just how widely.
States colored in dark green have highest gross state product (GSP) per capita; the lowest are in yellow. The size of each State is proportional to Real Gross Domestic Product for 2014. Real GDP is the US grew by 2.2% in 2014, higher than the 1.9% growth in 2013.
Again, state color shows the GDP per person while the state size reflects GDP overall.
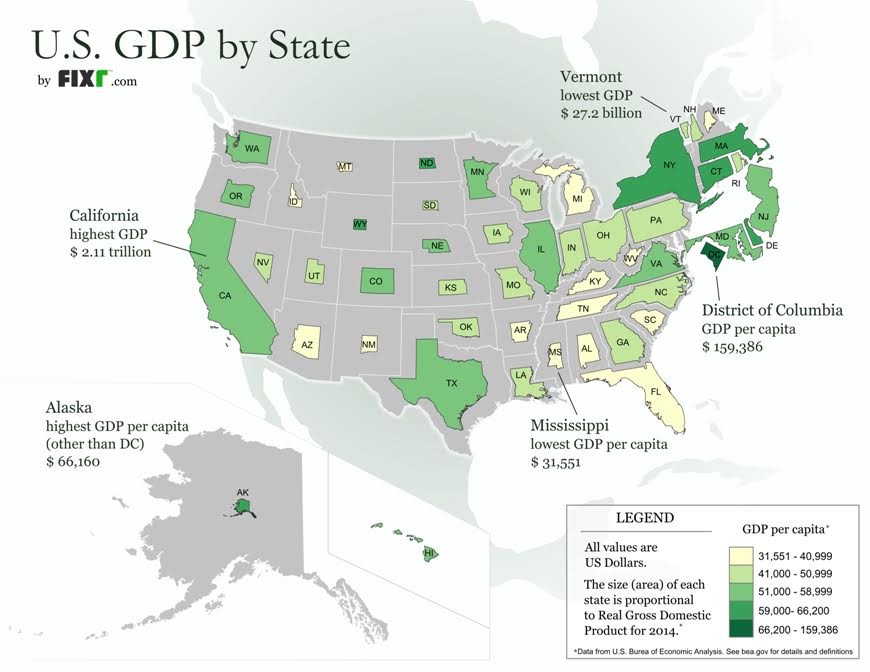
Source: Fixr