NorthStar Capital AdvisorsNorthStar Capital AdvisorsNorthStar Capital AdvisorsNorthStar Capital Advisors
Start Here
  • How We Help
  • Who We Serve
  • Who We Are
  • Fiduciary
  • Learning
  • Start Here
  • How We Help
  • Who We Serve
  • Who We Are
  • Fiduciary
  • Learning
  • Start Here

Weekly Market Review ~ Friday, 06/29/12

  • June 29, 2012/
  • Posted By : admin/
  • 0 comments /
  • Under : Weekly Market Review

Stocks fell worldwide on Monday as further impatience with a lack of progress in the Eurozone debt crisis caused the world’s major indexes to plummet 1-2%. On Tuesday, modest gains were had by the market on somewhat positive US housing data. The S&P 500 added nearly a percent on Wednesday on a report that May home sales beat expectations. Oil also rose back above $80/barrel. On Thursday, stocks started the day down, and fell further after news that Obamacare was upheld by the Supreme Court. However, the markets rebounded at the end of the day when rumors of a potential Euro debt solution began to circulate. The major indexes finished the week on Friday in a big way on very positive news out of Europe, in which European leaders agreed to appoint one supervisor to oversee all of Europe’s banks. Such progress spurred the Dow to gain almost 278 points, while the S&P 500 logged its largest gain of 2012.

[table id=69 /]


Myth Buster: Individual Investors are NOT Fleeing Stocks

  • June 28, 2012/
  • Posted By : admin/
  • 0 comments /
  • Under : 401(k), Mutual Funds, Retirement, Seeking Prudent Advice

The reports of my death are greatly exaggerated — Mark Twain

Stocks may be feeling a lot like Mark Twain once felt — discounted prematurely!

The financial media would have you believe that retail investors have been running, not walking, away from stocks. However, a massive, new study of U.S. investors shows the cold, hard facts say otherwise.

A recent Vanguard study sheds light on how individual investors are approaching stocks.  Vanguard reviewed the retirement accounts of 3 million Americans.  As of 2011, the average individual investors had an asset allocation that consists of

  • 65% in stocks
  • 17% in cash
  • 10% in bonds
  • 10% in balance funds
    (these add up to >100% because of rounding in the components)

Retirement savers have two-thirds of their money riding on stocks.  This allocation has declined only 8 percentage points since peaking in 2007.

Moreover, 71% of new contributions are going to purchase additional stocks, up 1% from 2010 and 3% from 2009.

What has changed significantly is how investors are purchasing their stocks.  Purchases directly through diversified stock funds is only 38% of contributions — down sharply from 51% in 2007.  However, stocks purchased via target-date funds are up.

So investors may be thinking they have been selling stocks but they continue to invest in them indirectly.

To quote Jason Zweig:
the public’s infatuation with stock funds isn’t dead. It’s alive and well, but it’s going in by the back door.


Weekly Market Review ~ Friday, 06/22/12

  • June 22, 2012/
  • Posted By : admin/
  • 0 comments /
  • Under : Weekly Market Review

The major indexes were mixed on Monday with the NASDAQ logging a nice gain, while the Dow slipped modestly, as eyes remain on the ongoing Greece/Spain financial woes. On Tuesday, all the indexes participated in a 1% gain as the hope for further government stimulus drove investors to buy more stock. Stocks failed to maintain the rally on Wednesday when the Fed held off on making any aggressive financial moves, instead opting only to extend the Treasuries buy/sell program Operation Twist until the end of the year. The bottom fell out Thursday with a 2% loss for the Dow, as a combination of weak international economic reports coupled with disappointment over the Fed’s lack of action sent stocks spiraling. Oil dropped to less than $80/barrel. The week ended on Friday on an up note, although the gain was not large enough to give the Dow or the S&P 500 a win for the week.

[table id=68 /]


2,000 Years of Economic History in One Chart

  • June 21, 2012/
  • Posted By : admin/
  • 0 comments /
  • Under : Economy

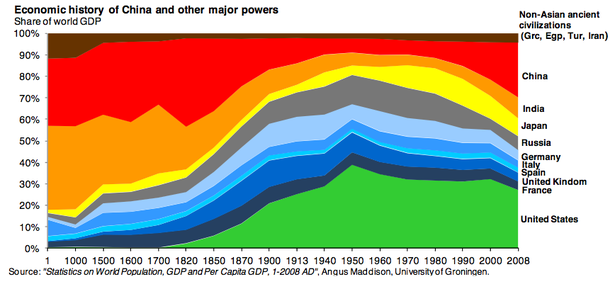
The fascinating graph above represents 2,000 years of economic history starting in 1 AD.  It was produced by Michael Cembalest, head of investment strategy at JP Morgan.

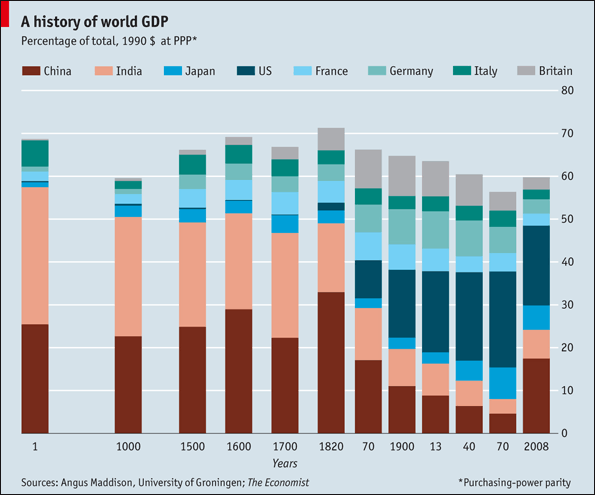
The ebb and flow of economic dominance is interesting.  India (orange) and China (red) dominated for roughly 1800 years.  However, they were pushed aside by growth in the United States (green), Western Europe (shades of blue), and Japan (yellow) which peaked by 1950.  Since then China has surged back toward a larger role.

The Economist published a different rendition that gives the time sampling on the x-axis a more rigorous treatment:


Weekly Market Review ~ Friday, 06/15/12

  • June 15, 2012/
  • Posted By : admin/
  • 0 comments /
  • Under : Weekly Market Review

The Dow snapped a 4-day winning streak when it closed down 1.1% on Monday. Despite early optimism, stocks sank as the likelihood of a Spanish bank bailout faded. The S&P 500 and Nasdaq fell 1.3% and 1.7%, respectively. Somewhat paradoxically, U.S. stocks surged Tuesday despite the on-going bleakness in Europe. The Dow climbed 1.3% while the S&P 500 gained 1.2%. The markets fell Wednesday as worries about Europe and weak U.S. economic data dominated investors’ outlook. Broad market indexes were off between 0.6% and 0.9%. In a “bad news is good news” scenario, stocks lifted Thursday on the expectation that central bankers will come to the rescue as the U.S. recovery continues to sputter and Europe is awash in debt woes. The Dow gained 1.2% and the S&P 500 was up 1.1%. The Dow saw another triple-digit gain Friday as investors continue to focus on an intervention from the Federal Reserve and European Central Bank to stabilize markets. The Dow, S&P 500, and Nasdaq gained 0.9%, 1.0%, and 1.3%, respectively.

[table id=67 /]


Oh Baby! You’re Expensive

  • June 14, 2012/
  • Posted By : admin/
  • 0 comments /
  • Under : Economy

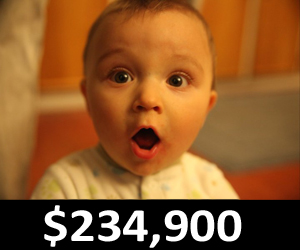
Many parents worry about saving for college, but don’t forget about the proceeding 17 years! Food, clothing, shelter, and other necessities will cost $234,900 for a child born in 2011 to a middle-income family.

Today the the U.S. Department of Agriculture released their annual report where they total up the cost that parents pay to raise a child from birth to age 17.

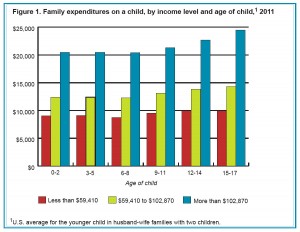
  • The annual expense per child ranges from $8,760 to $9,970 on average (depending on age) for households with an annual income less than $59,410.
  • The annual cost increases to $12,290 to $14,320 for households with income up to $102,870.
  • The annual cost increases yet again to $20,420 to $24,510 for households with annual income greater than $102,870.

Housing, childcare & education, and food comprise 64% of the expenses.

Family expenditures on a child, by income level and age of child (CLICK TO ENLARGE)

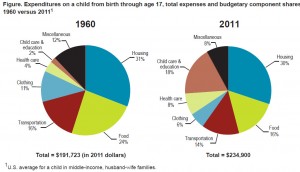
It’s interesting to compare the costs of raising a child born in 1960 (the year the USDA study first started) to a child of 2011.  The total cost has increased 22% from $191,723 in 1960 (in 2011 dollars) to $234,900 in 2011.

  • Food has decreased from 24% of the cost in 1960 to 16% in 2011
  • Clothing has shrunk from 11% in 1960 to 6% in 2011
  • Childcare & education has surged from only 2% in 1960 to 18% in 2011
  • Healthcare has doubled from 4% in 1960 to 8% in 2011

Expenditures on a child from birth through age 17, total expenses and budgetary component shares, 1960 versus 2011 (CLICK TO ENLARGE)


Weekly Market Review ~ Friday, 06/08/12

  • June 8, 2012/
  • Posted By : admin/
  • 0 comments /
  • Under : Weekly Market Review

Markets closed in mixed fashion on Monday following a surprise decline in U.S. factory orders. The Dow was down 0.1% while the S&P 500 was flat and the Nasdaq was up 0.5%. However, Tuesday the Dow broke a 4-day losing streak buoyed by unexpectedly strong service-sector data. The U.S. nonmanfacturing sector’s expansion accelerated in May contrary to expectations. The Dow, S&P 500 and Nasdaq rose 0.2%, 0.6%, and 0.7%, respectively. Come mid-week, stocks surged to their biggest daily gains seen this year as investors took solace Wednesday that central banks could cope with the economic troubles in Europe and the U.S. The Dow jumped 2.4%, its largest rise since mid-December and the S&P 500 saw a similar gain. Stocks close modestly up on Thursday on the news that China is cutting its interest rate to spur its slowing economy. The momentum carried into Friday as stocks rallied on the rumor of a potential Spanish bank bailouts. The Dow gained 0.7% and saw its biggest weekly gain since December. The S&P 500 rose 0.8%.

[table id=66 /]


Your 401(k) Is NOT Free

  • June 7, 2012/
  • Posted By : admin/
  • 0 comments /
  • Under : 401(k), Fees, Retirement

Fees charged on 401(k) retirement accounts are so obscure that most American are under the impression that they are free!

An AARP poll published last February demonstrated that 71% of respondents believe they do not pay fees on their 401(k)’s.  An additional 6% said we not sure if fees were levied.

In fact, there are two main fees associated with 401(k) plans: investment management fees and administrative fees.  A study from Deloitte and the Investment Company Institute release last November reported that the median 401(k) expense ratio is 0.78% but has a wide range from 0.28% to 1.38%.  These fees can be justifiable if the investment performance is good, but investors need to recognize that they are definitely paying a fee.

New rules are about to take effect that will force plan sponsors to disclose the total fees or expense ratio that investors must pay.


Weekly Market Review ~ Friday, 06/02/12

  • June 1, 2012/
  • Posted By : admin/
  • 0 comments /
  • Under : Weekly Market Review

The markets opened up the Memorial Day-shortened week on Tuesday with a solid gain after a Greek poll showed that the political party in favor of a bailout of Greece is leading the no-bailout party. On Wednesday, these gains were erased and then some on further Euro zone concerns, this time involving both Spain and Greece. Prices across the broad markets ebbed down 0.2% to 0.4% on Thursday closing out a tough month. The S&P 500, Nasdaq, and Dow fell 6.3%, 7.2%, and 6.2%, respectively, in May. A grim jobs report sank stocks Friday with the Dow seeing its worst day of the year. There was additional downward pressure from Europe’s debt troubles and China’s economic slowing.

[table id=65 /]


Recent Posts
  • SVB and bank collapses March 14,2023
  • 529 Rollovers (coming soon) February 6,2023
  • SECURE Act 2.0 (2023 changes inside) January 5,2023
  • Time-sensitive planning (action needed) November 2,2022
  • Market lessons you should know (inside) October 18,2022
Archives
  • March 2023
  • February 2023
  • January 2023
  • November 2022
  • October 2022
  • September 2022
  • August 2022
  • July 2022
  • May 2022
  • April 2022
  • March 2022
  • February 2022
  • December 2021
  • October 2021
  • September 2021
  • August 2021
  • July 2021
  • June 2021
  • May 2021
  • April 2021
  • March 2021
  • February 2021
  • January 2021
  • December 2020
  • November 2020
  • October 2020
  • September 2020
  • August 2020
  • July 2020
  • June 2020
  • May 2020
  • April 2020
  • March 2020
  • February 2020
  • November 2019
  • October 2019
  • June 2019
  • May 2019
  • April 2019
  • March 2019
  • February 2019
  • January 2019
  • December 2018
  • November 2018
  • October 2018
  • September 2018
  • August 2018
  • July 2018
  • June 2018
  • May 2018
  • April 2018
  • March 2018
  • February 2018
  • January 2018
  • December 2017
  • November 2017
  • October 2017
  • September 2017
  • August 2017
  • July 2017
  • June 2017
  • May 2017
  • April 2017
  • March 2017
  • February 2017
  • January 2017
  • December 2016
  • November 2016
  • October 2016
  • September 2016
  • August 2016
  • July 2016
  • June 2016
  • May 2016
  • April 2016
  • March 2016
  • February 2016
  • January 2016
  • December 2015
  • November 2015
  • October 2015
  • September 2015
  • August 2015
  • July 2015
  • June 2015
  • May 2015
  • April 2015
  • March 2015
  • February 2015
  • January 2015
  • December 2014
  • November 2014
  • October 2014
  • September 2014
  • August 2014
  • July 2014
  • June 2014
  • May 2014
  • April 2014
  • March 2014
  • February 2014
  • January 2014
  • December 2013
  • November 2013
  • October 2013
  • September 2013
  • August 2013
  • July 2013
  • June 2013
  • May 2013
  • April 2013
  • March 2013
  • February 2013
  • January 2013
  • December 2012
  • November 2012
  • October 2012
  • September 2012
  • August 2012
  • July 2012
  • June 2012
  • May 2012
  • April 2012
  • March 2012
  • February 2012
  • January 2012
  • December 2011
  • November 2011
  • October 2011
  • September 2011
  • August 2011
  • July 2011
  • June 2011
  • May 2011
  • April 2011
  • March 2011
  • February 2011
  • January 2011
  • November 2010
  • October 2010
  • September 2010
  • August 2010
Categories
  • 401(k)
  • Annuities
  • Behavior
  • Best Practices
  • Bonds
  • Charitable Donations
  • Economy
  • Fees
  • Fiduciary
  • Financial Planning
  • Investing 101
  • Live Well
  • Market Outlook
  • Mutual Funds
  • NorthStar
  • Performance
  • Personal Finance
  • Planning
  • Retirement
  • Saving Money
  • Scams & Schemes
  • Seeking Prudent Advice
  • Tax Planning
  • Uncategorised
  • Uncategorized
  • Weekly Market Review
ABOUT US

We are a fee-only, independent fiduciary advisor. Our allegiance rests solely with our clients and their best interests. We are headquartered in Charlotte, North Carolina and serve client families across the nation.


CLIENT TOOLS
CONTACT
  • (704) 350-5028
  • info@nstarcapital.com
  • 521 East Blvd, Charlotte, NC 28203
    (by appointment only)
  • fax: (704) 626-3462
FROM OUR BLOG
  • SVB and bank collapses March 14,2023
  • 529 Rollovers (coming soon) February 6,2023
  • SECURE Act 2.0 (2023 changes inside) January 5,2023
Nothing on this website constitutes either the provision of investment advice or solicitation to provide investment advice. Investment advice can only be provided through a formal investment advisory relationship. Copyright © 2023 NorthStar Capital Advisors - Charlotte, NC. All Rights Reserved.