NorthStar Capital AdvisorsNorthStar Capital AdvisorsNorthStar Capital AdvisorsNorthStar Capital Advisors
Start Here
  • How We Help
  • Who We Serve
  • Who We Are
  • Fiduciary
  • Learning
  • Start Here
  • How We Help
  • Who We Serve
  • Who We Are
  • Fiduciary
  • Learning
  • Start Here

Sir Isaac Newton: Monumental Scientist, Terrible Investor

  • January 30, 2014/
  • Posted By : admin/
  • 0 comments /
  • Under : Behavior, Seeking Prudent Advice

220px-GodfreyKneller-IsaacNewton-1689Most people recognize Sir Isaac Newton as one of the most influential scientists of all time, but did you know he was a horrible investor?

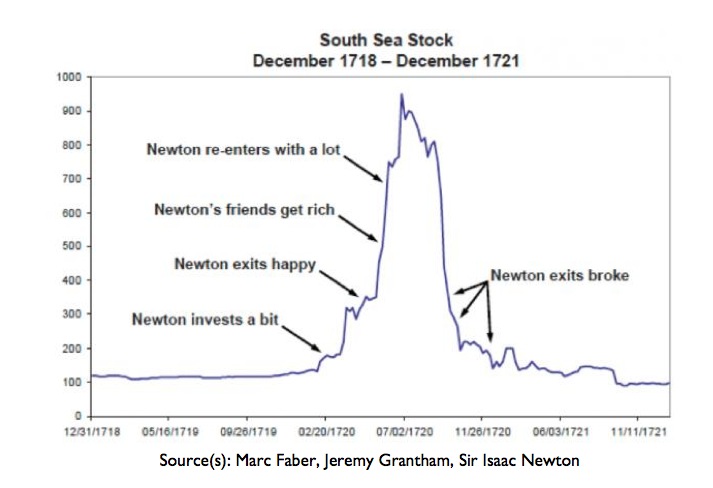
Newton’s experience with the South Sea Company vividly demonstrates the financial perils of chasing hot markets, getting caught up in investment bubbles, and not maintaining a diversified portfolio.

In the early 18th century the South Sea Company was established and given a monopoly on trade in the South Seas in return for assuming England’s war debt.  Investors liked the idea of that monopoly and the company’s stock began to take off.

Newton hear the siren call of the South Sea Company, invested his cash in early 1720 and managed to turn a nice profit.  But then the stock kept soaring after he had gotten out. So Newton jumped back into the stock with a lot more money than his original investment.

Newton subsequently lost 20,000 pounds, almost all of his life savings!  From this terrible outcome, Newton supposedly decreed, “I can calculate the movement of the stars, but not the madness of men.”

No warning on Earth can save people determined to grow suddenly rich.
— Lord Overstone

newton-investsSource: Sovereign Man


What’s a Mom Worth?

  • January 23, 2014/
  • Posted By : admin/
  • 0 comments /
  • Under : Economy
Stay-at-home moms work an average of 94 hours a week and would collect a “mom salary” of $113,586 a year.
stay-at-home-mom2013

Working mothers spend 40 hours a week at the office, but then come home
working-mom2013 and perform an average of 58 hours per week on household and childcare duties.

Market Timing & Emotions ~ Afflictions of the Average Investor

  • January 16, 2014/
  • Posted By : admin/
  • 0 comments /
  • Under : Behavior, Performance, Personal Finance, Seeking Prudent Advice
investor-results

Click to enlarge

This chart of 20 years of market data vividly demonstrates a painful lesson.  The average investor* badly trails all classes of investment assets.

The primary culprit for this deficit is ill-fated attempts to time the market and emotionally driven decisions to move in and out of the markets.

Most individuals claim to be long-term investor until their portfolio drops 10% and suddenly there’s panic.

Our primary role as an investment advisor is to help our clients have the discipline to ignore the gyrations of the markets and keep the long view when it comes to their investments.

* Average investor refers to individual investors across the United States


North Carolina Stocks Were Strong Performers in 2013

  • January 9, 2014/
  • Posted By : admin/
  • 0 comments /
  • Under : Performance

north_carolina_flagThe fifty largest publicly traded companies headquartered in North Carolina fared very well overall in the 2013 stock market.  The Tarheel group gained 28.3%,  comparable to the 29.6% put up by the S&P 500.

Note the 2013 returns were much larger than the long-term average.

These NC stocks have return 12.3% per year over the last 5 years, far outperforming the S&P 500 which delivered only 4.8% over the same time period (2008-2013).

North Carolina’s 50 largest publicly traded companies, excluding companies that went public during the year. They are in order by annual revenue.

Company Headquarters 2013 close 2012 close 2008 close 1-year return 5-year return
Bank of America Corp. Charlotte $15.57 $11.61 $14.08 34% 11%
Lowe’s Cos. Inc. Mooresville $49.55 $35.52 $21.52 39% 130%
Duke Energy Corp. Charlotte $69.01 $63.80 $45.03 8% 53%
Nucor Corp. Charlotte $53.38 $43.16 $46.20 24% 16%
VF Corp. Greensboro $62.34 $37.74 $13.69 65% 355%
BB&T Corp. Winston-Salem $37.32 $29.11 $27.46 28% 36%
Family Dollar Stores Matthews $64.97 $63.41 $26.07 2% 149%
Sonic Automotive Inc. Charlotte $24.48 $20.89 $3.98 17% 515%
Reynolds American Inc. Winston Salem $49.99 $41.43 $20.16 21% 148%
Pantry Inc. Cary $16.78 $12.13 $21.45 38% -22%
Laboratory Corp. of America Burlington $91.37 $86.62 $64.41 5% 42%
SPX Corp. Charlotte $99.61 $70.15 $40.55 42% 146%
Lorillard Inc. Greensboro $50.68 $38.89 $18.78 30% 170%
Harris Teeter Supermarkets Matthews $49.35 $38.56 $27.65 28% 78%
Hanesbrands Inc. Winston Salem $70.27 $35.82 $12.75 96% 451%
Ingles Markets Inc. Black Mountain $27.10 $17.26 $17.59 57% 54%
Carlisle Cos. Inc. Charlotte $79.40 $58.76 $20.70 35% 284%
Babcock & Wilcox Co. Charlotte $34.19 $26.20 N.A. 30% N.A.
Chiquita Brands International Charlotte $11.70 $8.25 $14.78 42% -21%
Alliance One International Morrisville $3.05 $3.64 $2.94 -16% 4%
Old Dominion Freight Line Thomasville $53.02 $34.28 $12.65 55% 319%
Martin Marietta Materials Raleigh $99.94 $94.28 $97.08 6% 3%
Snyders-Lance Inc. Charlotte $28.66 $24.12 $22.94 19% 25%
Coca-Cola Bottling Co. Charlotte $73.19 $66.50 $45.96 10% 59%
Cree Inc. Durham $56.04 $52.96 $13.22 6% 324%
Fresh Market Inc. Greensboro $62.52 $33.98 $15.87 84% 294%
Red Hat Inc. Raleigh $40.50 $48.09 N.A. -16% N.A.
Piedmont Natural Gas Co. Charlotte $33.16 $31.31 $31.67 6% 5%
RF Micro Devices Inc. Greensboro $5.16 $4.48 $0.78 15% 562%
EnPro Industries Inc. Charlotte $57.65 $40.90 $21.54 41% 168%
First Citizens Bancshares Raleigh $222.63 $163.50 $152.80 36% 46%
Horizon Lines Inc. Charlotte $0.84 $1.50 $87.25 -44% -99%
Fairpoint Communications Inc. Charlotte $11.31 $7.95 N.A. 42% N.A.
Cato Corp. Charlotte $31.80 $27.43 $15.10 16% 111%
Salix Pharmaceuticals Ltd. Raleigh $89.94 $40.47 $8.83 122% 919%
Pike Corp. Mount Airy $10.57 $9.55 $12.30 11% -14%
Unifi Inc. Greensboro $27.24 $13.01 $8.46 109% 222%
Polypore International Inc. Charlotte $38.90 $46.50 $7.56 -16% 415%
Highwoods Properties Inc. Raleigh $36.17 $33.45 $27.36 8% 32%
Xerium Technologies Inc. Raleigh $16.49 $3.05 $13.20 441% 25%
Speedway Motorsports Inc. Concord $19.85 $17.84 $16.11 11% 23%
Krispy Kreme Doughnuts Inc. Winston-Salem $19.29 $9.38 $1.68 106% 1048%
Tanger Factory Outlet Centers Inc. Greensboro $32.02 $34.20 $18.81 -6% 70%
Insteel Industries Inc. Mount Airy $22.73 $12.48 $11.29 82% 101%
Culp Inc. High Point $20.45 $15.01 $1.98 36% 933%
Powersecure International Inc. Wake Forest $17.17 $7.81 $3.29 120% 422%
Hatteras Financial Corp. Winston-Salem $16.34 $24.81 $26.60 -34% -39%
Swisher Hygiene Inc. Charlotte $0.55 $1.73 $0.37 -68% 49%
Triad Guaranty Inc. Winston-Salem $0.27 $0.07 $0.38 286% -29%
Cornerstone Therapeutics Inc. Cary $9.49 $4.73 $2.65 101% 258%
 
NC 50 OVERALL 28.3% 12.3%
S&P 500 29.6% 4.8%
  annualized

source: Charlotte Observer


All 10 Stock Sectors Post Gains in Big Year

  • January 2, 2014/
  • Posted By : admin/
  • 0 comments /
  • Under : Performance
stocksectors2013

Click to enlarge

All 10 of the S&P 500’s stock sectors finished 2013 in positive territory. Stocks most closely tied to economic growth fared best in 2013, while those typically regarded as the safest bets logged the year’s smallest gains.

Source: WSJ


Recent Posts
  • SVB and bank collapses March 14,2023
  • 529 Rollovers (coming soon) February 6,2023
  • SECURE Act 2.0 (2023 changes inside) January 5,2023
  • Time-sensitive planning (action needed) November 2,2022
  • Market lessons you should know (inside) October 18,2022
Archives
  • March 2023
  • February 2023
  • January 2023
  • November 2022
  • October 2022
  • September 2022
  • August 2022
  • July 2022
  • May 2022
  • April 2022
  • March 2022
  • February 2022
  • December 2021
  • October 2021
  • September 2021
  • August 2021
  • July 2021
  • June 2021
  • May 2021
  • April 2021
  • March 2021
  • February 2021
  • January 2021
  • December 2020
  • November 2020
  • October 2020
  • September 2020
  • August 2020
  • July 2020
  • June 2020
  • May 2020
  • April 2020
  • March 2020
  • February 2020
  • November 2019
  • October 2019
  • June 2019
  • May 2019
  • April 2019
  • March 2019
  • February 2019
  • January 2019
  • December 2018
  • November 2018
  • October 2018
  • September 2018
  • August 2018
  • July 2018
  • June 2018
  • May 2018
  • April 2018
  • March 2018
  • February 2018
  • January 2018
  • December 2017
  • November 2017
  • October 2017
  • September 2017
  • August 2017
  • July 2017
  • June 2017
  • May 2017
  • April 2017
  • March 2017
  • February 2017
  • January 2017
  • December 2016
  • November 2016
  • October 2016
  • September 2016
  • August 2016
  • July 2016
  • June 2016
  • May 2016
  • April 2016
  • March 2016
  • February 2016
  • January 2016
  • December 2015
  • November 2015
  • October 2015
  • September 2015
  • August 2015
  • July 2015
  • June 2015
  • May 2015
  • April 2015
  • March 2015
  • February 2015
  • January 2015
  • December 2014
  • November 2014
  • October 2014
  • September 2014
  • August 2014
  • July 2014
  • June 2014
  • May 2014
  • April 2014
  • March 2014
  • February 2014
  • January 2014
  • December 2013
  • November 2013
  • October 2013
  • September 2013
  • August 2013
  • July 2013
  • June 2013
  • May 2013
  • April 2013
  • March 2013
  • February 2013
  • January 2013
  • December 2012
  • November 2012
  • October 2012
  • September 2012
  • August 2012
  • July 2012
  • June 2012
  • May 2012
  • April 2012
  • March 2012
  • February 2012
  • January 2012
  • December 2011
  • November 2011
  • October 2011
  • September 2011
  • August 2011
  • July 2011
  • June 2011
  • May 2011
  • April 2011
  • March 2011
  • February 2011
  • January 2011
  • November 2010
  • October 2010
  • September 2010
  • August 2010
Categories
  • 401(k)
  • Annuities
  • Behavior
  • Best Practices
  • Bonds
  • Charitable Donations
  • Economy
  • Fees
  • Fiduciary
  • Financial Planning
  • Investing 101
  • Live Well
  • Market Outlook
  • Mutual Funds
  • NorthStar
  • Performance
  • Personal Finance
  • Planning
  • Retirement
  • Saving Money
  • Scams & Schemes
  • Seeking Prudent Advice
  • Tax Planning
  • Uncategorised
  • Uncategorized
  • Weekly Market Review
ABOUT US

We are a fee-only, independent fiduciary advisor. Our allegiance rests solely with our clients and their best interests. We are headquartered in Charlotte, North Carolina and serve client families across the nation.


CLIENT TOOLS
CONTACT
  • (704) 350-5028
  • info@nstarcapital.com
  • 521 East Blvd, Charlotte, NC 28203
    (by appointment only)
  • fax: (704) 626-3462
FROM OUR BLOG
  • SVB and bank collapses March 14,2023
  • 529 Rollovers (coming soon) February 6,2023
  • SECURE Act 2.0 (2023 changes inside) January 5,2023
Nothing on this website constitutes either the provision of investment advice or solicitation to provide investment advice. Investment advice can only be provided through a formal investment advisory relationship. Copyright © 2023 NorthStar Capital Advisors - Charlotte, NC. All Rights Reserved.