NorthStar Capital AdvisorsNorthStar Capital AdvisorsNorthStar Capital AdvisorsNorthStar Capital Advisors
Start Here
  • How We Help
  • Who We Serve
  • Who We Are
  • Fiduciary
  • Learning
  • Start Here
  • How We Help
  • Who We Serve
  • Who We Are
  • Fiduciary
  • Learning
  • Start Here

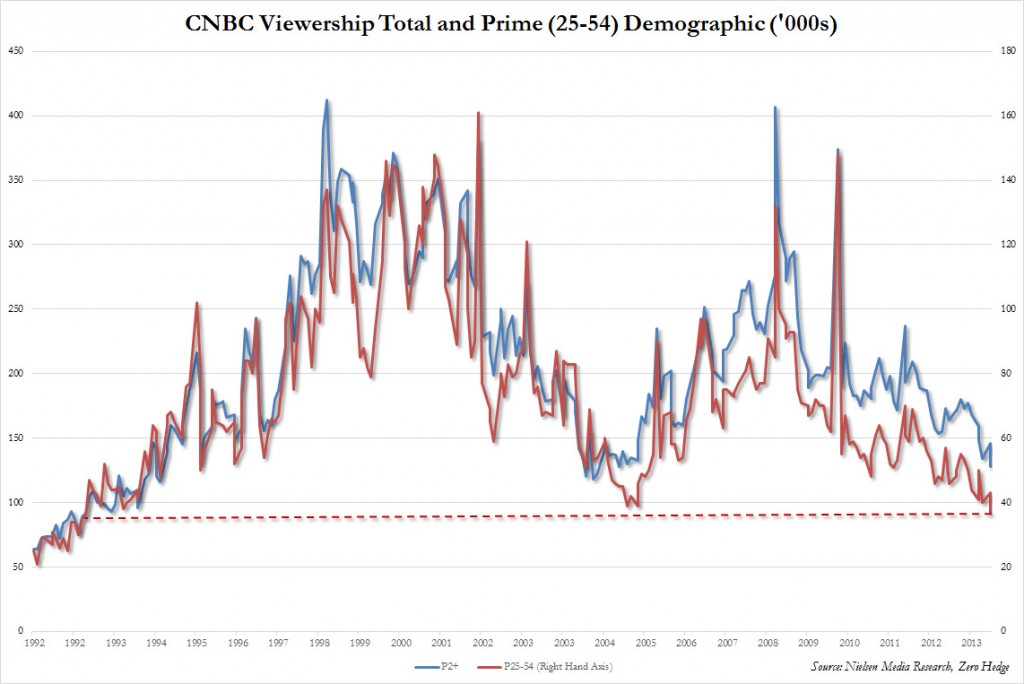
CNBC Core Viewership Drops to 20-Year Low — Why that’s a good thing!

  • August 29, 2013/
  • Posted By : admin/
  • 0 comments /
  • Under : Economy, Market Outlook, Scams & Schemes, Seeking Prudent Advice

Click to zoom

According to the latest Nielsen data, CNBC’s prime viewership (age 25-54 demographic) just tumbled to a fresh 20 year low of just 37,000, the lowest since March 1993. CNBC’s Fast Money (fell 32% vs previous year), Mad Money (fell 42% year-over-year) and Kudlow (fell 52% year-over-year) all had all time low ratings in the “all viewers” category in August 2013.

So why is this a good thing?

This is good news for individual investors and their advocates because it means less people are being negatively influenced by CNBC’s misinformation.

CNBC’s goal is not to make you money, but to sell advertising.They want you to live in fear and react to every little hiccup in the market so that you’re glued to their network in order to receive investment advice from their guests and anchors. But if you make just one move to improve your portfolio’s performance this year, it should be turning off CNBC. In fact, you should tune out most of the financial media. 

If you’re invested for the long haul, it really doesn’t matter…

  • If inflation is up two-tenths of a percentage point this year,
  • Or if the Consumer Confidence Index dips 3%,
  • Or if the Bull Bear Sentiment Indicator switches from bullish to bearish.

Your portfolio should be positioned to withstand good times and bad. You shouldn’t be jumping in and out of the market or sectors based on news, politics, the economy, or any other event.


Focus On the Big Picture

  • August 22, 2013/
  • Posted By : admin/
  • 0 comments /
  • Under : Seeking Prudent Advice

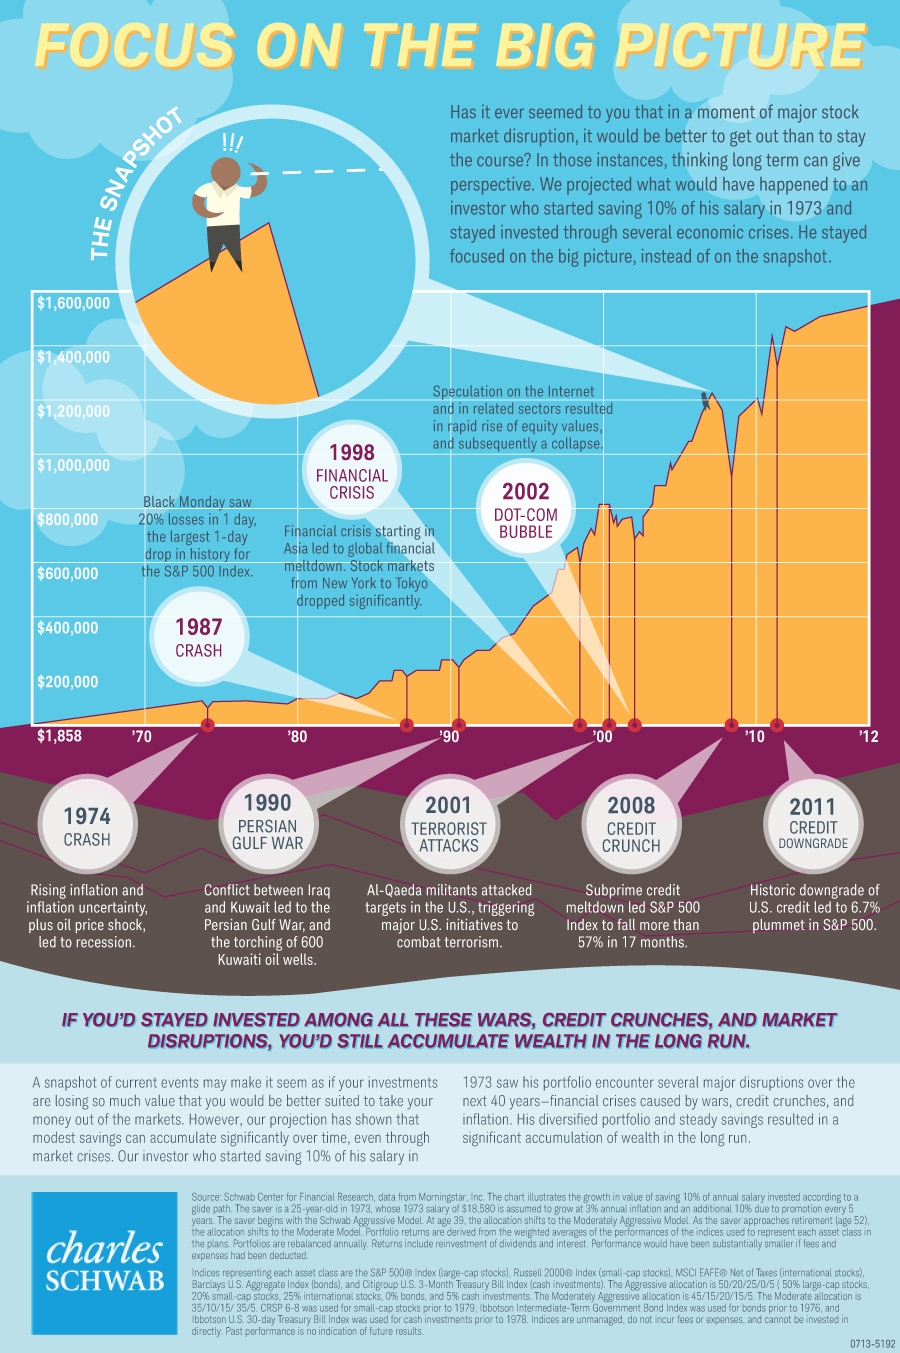
Good infographic from Charles Schwab about the big picture…

Be sure to click to zoom up for a good view


America’s Worst Charities

  • August 15, 2013/
  • Posted By : admin/
  • 0 comments /
  • Under : Seeking Prudent Advice

The Tampa Bay Times and the Center for Investigative Reporting identified the 50 worst charities in the US (see table below). These are organizations that purport to help the needy but devote pennies on the dollar to worth causes.  The Pulitzer Prize worthy series is published in the Tampa Bay Times: America’s Worst Charities.

Here’s an eye-opening and infuriating preview:

The worst charity in America operates from a metal warehouse behind a gas station in Holiday.

Every year, Kids Wish Network raises millions of dollars in donations in the name of dying children and their families.

Every year, it spends less than 3 cents on the dollar helping kids.

Most of the rest gets diverted to enrich the charity’s operators and the for-profit companies Kids Wish hires to drum up donations.

In the past decade alone, Kids Wish has channeled nearly $110 million donated for sick children to its corporate solicitors. An additional $4.8 million has gone to pay the charity’s founder and his own consulting firms.

The following tips can help you make an informed decision when the phone rings from a charity:

Key questions to ask the caller:

  • What is the full name of the charity?
  • Do you work for a paid fundraiser?
  • How much of my donation actually goes to charity?
  • Will any local programs directly benefit? If so, how?
  • What is the website address of the charity?

Key facts to know:

  • The best charities spend no more than 35 cents of every dollar raised on fundraising costs
  • America’s worst charities spend more than 80 cent of every dollar on fundraising
  • Charities that use telemarketing firms and fundraisers are far more likely to receive only a fraction of the money raised


The 50 Worst, Ranked by Money Blown on Soliciting Costs

Rank Charity name Total raised by solicitors Paid to solicitors % spent on direct cash aid
1 Kids Wish Network $127.8 million $109.8 million 2.5%
2 Cancer Fund of America $98.0 million $80.4 million 0.9%
3 Children’s Wish Foundation International $96.8 million $63.6 million 10.8%
4 American Breast Cancer Foundation $80.8 million $59.8 million 5.3%
5 Firefighters Charitable Foundation $63.8 million $54.7 million 8.4%
6 Breast Cancer Relief Foundation $63.9 million $44.8 million 2.2%
7 International Union of Police Associations, AFL-CIO $57.2 million $41.4 million 0.5%
8 National Veterans Service Fund $70.2 million $36.9 million 7.8%
9 American Association of State Troopers $45.0 million $36.0 million 8.6%
10 Children’s Cancer Fund of America $37.5 million $29.2 million 5.3%
11 Children’s Cancer Recovery Foundation $34.7 million $27.6 million 0.6%
12 Youth Development Fund $29.7 million $24.5 million 0.8%
13 Committee For Missing Children $26.9 million $23.8 million 0.8%
14 Association for Firefighters and Paramedics $23.2 million $20.8 million 3.1%
15 Project Cure (Bradenton, FL) $51.5 million $20.4 million 0.0%
16 National Caregiving Foundation $22.3 million $18.1 million 3.5%
17 Operation Lookout National Center for Missing Youth $19.6 million $16.1 million 0.0%
18 United States Deputy Sheriffs’ Association $23.1 million $15.9 million 0.6%
19 Vietnow National Headquarters $18.1 million $15.9 million 2.9%
20 Police Protective Fund $34.9 million $14.8 million 0.8%
21 National Cancer Coalition $41.5 million $14.0 million 1.1%
22 Woman To Woman Breast Cancer Foundation $14.5 million $13.7 million 0.4%
23 American Foundation For Disabled Children $16.4 million $13.4 million 0.8%
24 The Veterans Fund $15.7 million $12.9 million 2.3%
25 Heart Support of America $33.0 million $11.0 million 3.4%
26 Veterans Assistance Foundation $12.2 million $11.0 million 10.5%
27 Children’s Charity Fund $14.3 million $10.5 million 2.3%
28 Wishing Well Foundation USA $12.4 million $9.8 million 4.6%
29 Defeat Diabetes Foundation $13.8 million $8.3 million 0.1%
30 Disabled Police Officers of America Inc. $10.3 million $8.1 million 2.5%
31 National Police Defense Foundation $9.9 million $7.8 million 5.8%
32 American Association of the Deaf & Blind $10.3 million $7.8 million 0.1%
33 Reserve Police Officers Association $8.7 million $7.7 million 1.1%
34 Optimal Medical Foundation $7.9 million $7.6 million 1.0%
35 Disabled Police and Sheriffs Foundation $9.0 million $7.6 million 1.0%
36 Disabled Police Officers Counseling Center $8.2 million $6.9 million 0.1%
37 Children’s Leukemia Research Association $9.8 million $6.8 million 11.1%
38 United Breast Cancer Foundation $11.6 million $6.6 million 6.3%
39 Shiloh International Ministries $8.0 million $6.2 million 1.3%
40 Circle of Friends For American Veterans $7.8 million $5.7 million 6.5%
41 Find the Children $7.6 million $5.0 million 5.7%
42 Survivors and Victims Empowered $7.7 million $4.8 million 0.0%
43 Firefighters Assistance Fund $5.6 million $4.6 million 3.2%
44 Caring for Our Children Foundation $4.7 million $4.1 million 1.6%
45 National Narcotic Officers Associations Coalition $4.8 million $4.0 million 0.0%
46 American Foundation for Children With AIDS $5.2 million $3.0 million 0.0%
47 Our American Veterans $2.6 million $2.3 million 2.3%
48 Roger Wyburn-Mason & Jack M Blount Foundation For Eradication of Rheumatoid Disease $8.4 million $1.8 million 0.0%
49 Firefighters Burn Fund $2.0 million $1.7 million 1.5%
50 Hope Cancer Fund $1.9 million $1.6 million 0.5%

Source: Tampa Bay Times


Annual Returns by Asset Class

  • August 8, 2013/
  • Posted By : admin/
  • 0 comments /
  • Under : Market Outlook, Performance

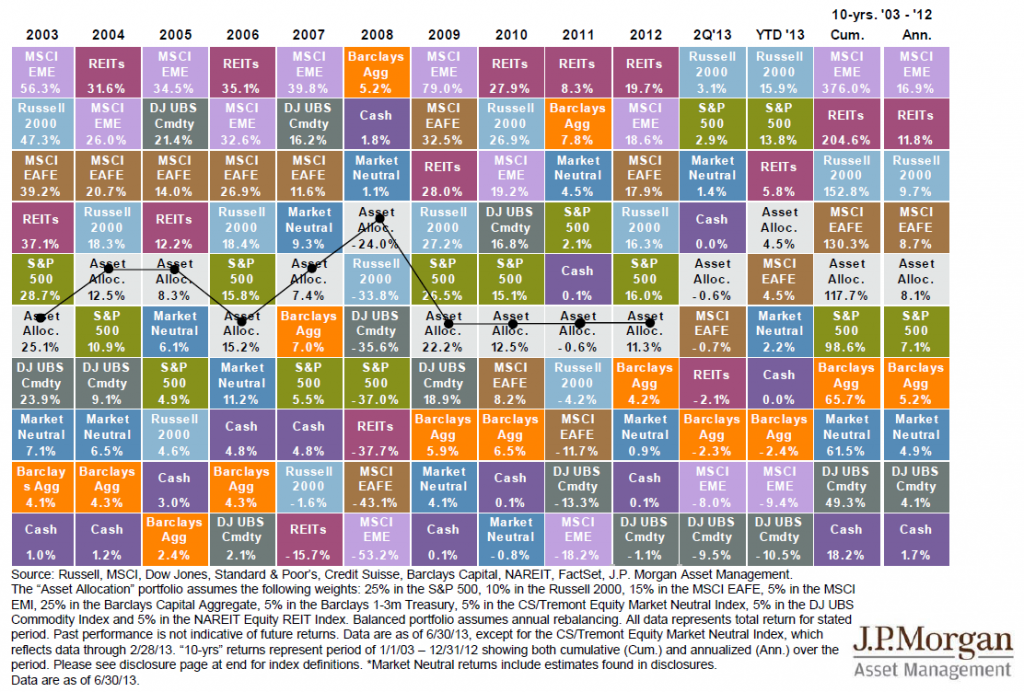
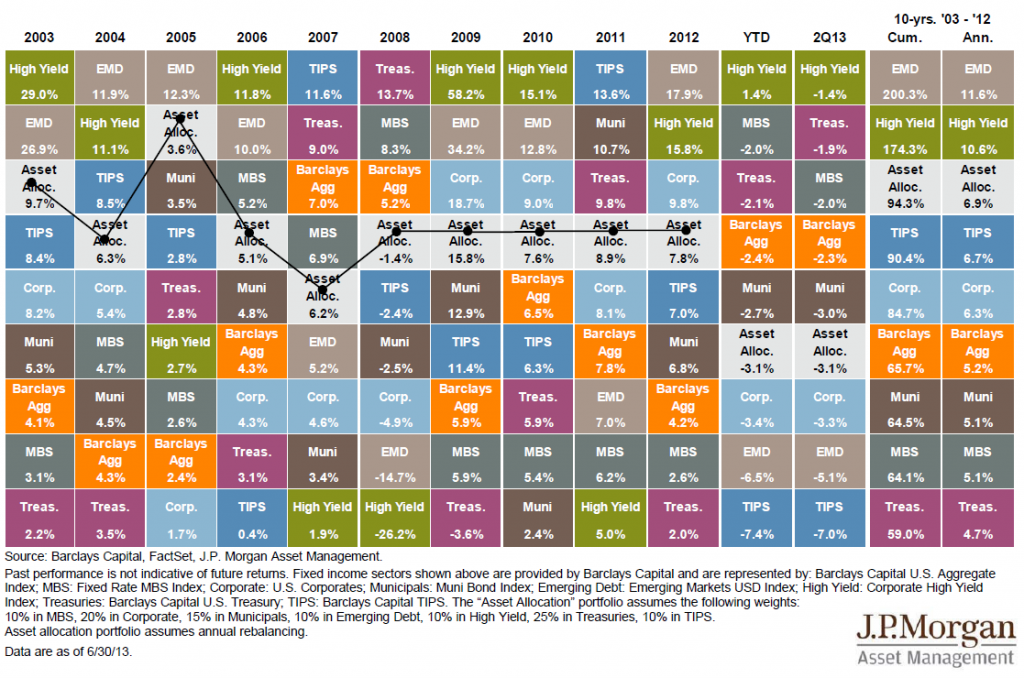
These charts show how different asset classes rank each year over the past 10 years (best performers on top).  This is an excellent demonstration of how hard it is to predict the future and how often the least-popular investments outperform common expectations.

Click to enlarge

Click to enlarge

Source: J.P. Morgan


The Cost Of Sitting On Cash

  • August 1, 2013/
  • Posted By : admin/
  • 0 comments /
  • Under : Market Outlook, Performance

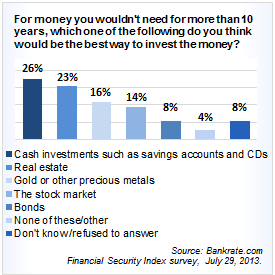
According to the latest financial security index by Bankrate.com, here’s how Americans prefer to invest money that they don’t need for more than 10 years:

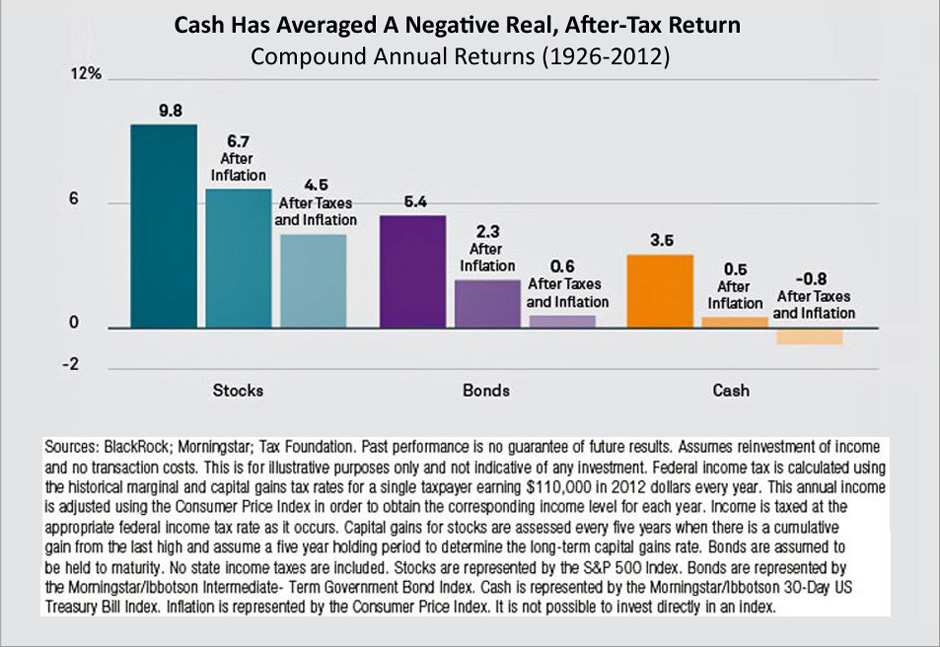
26% say they prefer cash for long-term investments.  Cash is arguably a great place to store your wealth briefly, however 80 years of data show cash is a horrible long-term investment. 

The following chart shows that cash has averaged a negative real, after-tax return (be sure to click on the chart for a closer look).  Inflation and taxes are killers.

Click to enlarge

“Americans not saving enough is well-documented, but hunkering down in cash investments and settling for low returns will only magnify the problem of not having a sufficient nest egg to meet longer-range financial goals such as retirement,” said Greg McBride, CFA, Bankrate.com’s senior financial analyst. “Other choices may not do the trick either, as real estate is not only very cash-intensive, but often illiquid. And precious metals spit out zero cash flows, with gains solely dependent on price appreciation.”
Sources:
BankRate.com
BlackRock

Recent Posts
  • SVB and bank collapses March 14,2023
  • 529 Rollovers (coming soon) February 6,2023
  • SECURE Act 2.0 (2023 changes inside) January 5,2023
  • Time-sensitive planning (action needed) November 2,2022
  • Market lessons you should know (inside) October 18,2022
Archives
  • March 2023
  • February 2023
  • January 2023
  • November 2022
  • October 2022
  • September 2022
  • August 2022
  • July 2022
  • May 2022
  • April 2022
  • March 2022
  • February 2022
  • December 2021
  • October 2021
  • September 2021
  • August 2021
  • July 2021
  • June 2021
  • May 2021
  • April 2021
  • March 2021
  • February 2021
  • January 2021
  • December 2020
  • November 2020
  • October 2020
  • September 2020
  • August 2020
  • July 2020
  • June 2020
  • May 2020
  • April 2020
  • March 2020
  • February 2020
  • November 2019
  • October 2019
  • June 2019
  • May 2019
  • April 2019
  • March 2019
  • February 2019
  • January 2019
  • December 2018
  • November 2018
  • October 2018
  • September 2018
  • August 2018
  • July 2018
  • June 2018
  • May 2018
  • April 2018
  • March 2018
  • February 2018
  • January 2018
  • December 2017
  • November 2017
  • October 2017
  • September 2017
  • August 2017
  • July 2017
  • June 2017
  • May 2017
  • April 2017
  • March 2017
  • February 2017
  • January 2017
  • December 2016
  • November 2016
  • October 2016
  • September 2016
  • August 2016
  • July 2016
  • June 2016
  • May 2016
  • April 2016
  • March 2016
  • February 2016
  • January 2016
  • December 2015
  • November 2015
  • October 2015
  • September 2015
  • August 2015
  • July 2015
  • June 2015
  • May 2015
  • April 2015
  • March 2015
  • February 2015
  • January 2015
  • December 2014
  • November 2014
  • October 2014
  • September 2014
  • August 2014
  • July 2014
  • June 2014
  • May 2014
  • April 2014
  • March 2014
  • February 2014
  • January 2014
  • December 2013
  • November 2013
  • October 2013
  • September 2013
  • August 2013
  • July 2013
  • June 2013
  • May 2013
  • April 2013
  • March 2013
  • February 2013
  • January 2013
  • December 2012
  • November 2012
  • October 2012
  • September 2012
  • August 2012
  • July 2012
  • June 2012
  • May 2012
  • April 2012
  • March 2012
  • February 2012
  • January 2012
  • December 2011
  • November 2011
  • October 2011
  • September 2011
  • August 2011
  • July 2011
  • June 2011
  • May 2011
  • April 2011
  • March 2011
  • February 2011
  • January 2011
  • November 2010
  • October 2010
  • September 2010
  • August 2010
Categories
  • 401(k)
  • Annuities
  • Behavior
  • Best Practices
  • Bonds
  • Charitable Donations
  • Economy
  • Fees
  • Fiduciary
  • Financial Planning
  • Investing 101
  • Live Well
  • Market Outlook
  • Mutual Funds
  • NorthStar
  • Performance
  • Personal Finance
  • Planning
  • Retirement
  • Saving Money
  • Scams & Schemes
  • Seeking Prudent Advice
  • Tax Planning
  • Uncategorised
  • Uncategorized
  • Weekly Market Review
ABOUT US

We are a fee-only, independent fiduciary advisor. Our allegiance rests solely with our clients and their best interests. We are headquartered in Charlotte, North Carolina and serve client families across the nation.


CLIENT TOOLS
CONTACT
  • (704) 350-5028
  • info@nstarcapital.com
  • 521 East Blvd, Charlotte, NC 28203
    (by appointment only)
  • fax: (704) 626-3462
FROM OUR BLOG
  • SVB and bank collapses March 14,2023
  • 529 Rollovers (coming soon) February 6,2023
  • SECURE Act 2.0 (2023 changes inside) January 5,2023
Nothing on this website constitutes either the provision of investment advice or solicitation to provide investment advice. Investment advice can only be provided through a formal investment advisory relationship. Copyright © 2023 NorthStar Capital Advisors - Charlotte, NC. All Rights Reserved.