NorthStar Capital AdvisorsNorthStar Capital AdvisorsNorthStar Capital AdvisorsNorthStar Capital Advisors
Start Here
  • How We Help
  • Who We Serve
  • Who We Are
  • Fiduciary
  • Learning
  • Start Here
  • How We Help
  • Who We Serve
  • Who We Are
  • Fiduciary
  • Learning
  • Start Here

The Cost Of Sitting On Cash

  • August 1, 2013/
  • Posted By : admin/
  • 0 comments /
  • Under : Market Outlook, Performance

According to the latest financial security index by Bankrate.com, here’s how Americans prefer to invest money that they don’t need for more than 10 years:
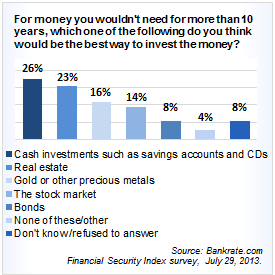
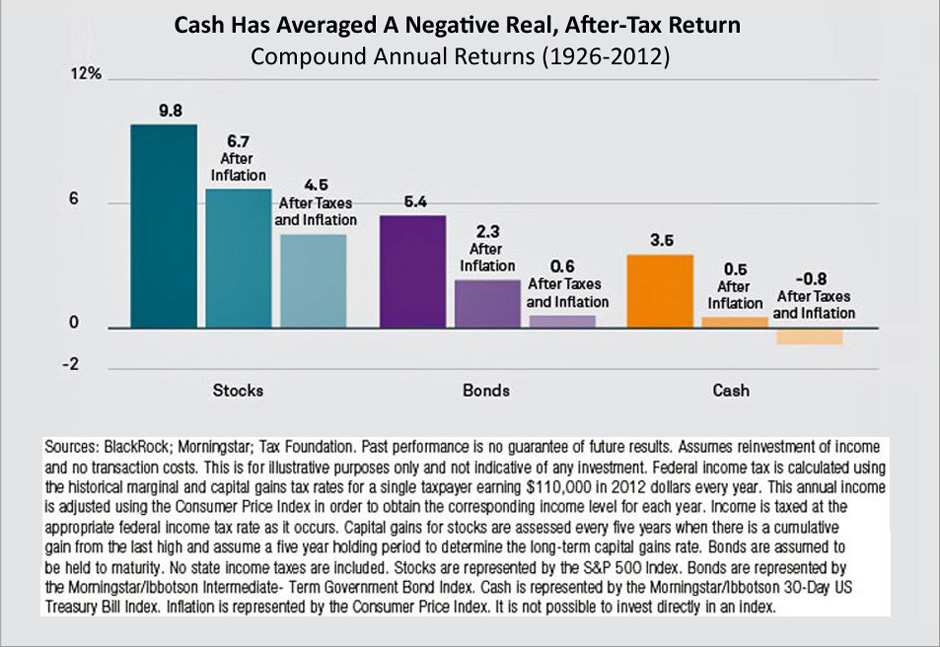
26% say they prefer cash for long-term investments.  Cash is arguably a great place to store your wealth briefly, however 80 years of data show cash is a horrible long-term investment. 

The following chart shows that cash has averaged a negative real, after-tax return (be sure to click on the chart for a closer look).  Inflation and taxes are killers.

Click to enlarge

“Americans not saving enough is well-documented, but hunkering down in cash investments and settling for low returns will only magnify the problem of not having a sufficient nest egg to meet longer-range financial goals such as retirement,” said Greg McBride, CFA, Bankrate.com’s senior financial analyst. “Other choices may not do the trick either, as real estate is not only very cash-intensive, but often illiquid. And precious metals spit out zero cash flows, with gains solely dependent on price appreciation.”
Sources:
BankRate.com
BlackRock

Strongest Bull Market Since WWII

  • July 25, 2013/
  • Posted By : admin/
  • 0 comments /
  • Under : Market Outlook

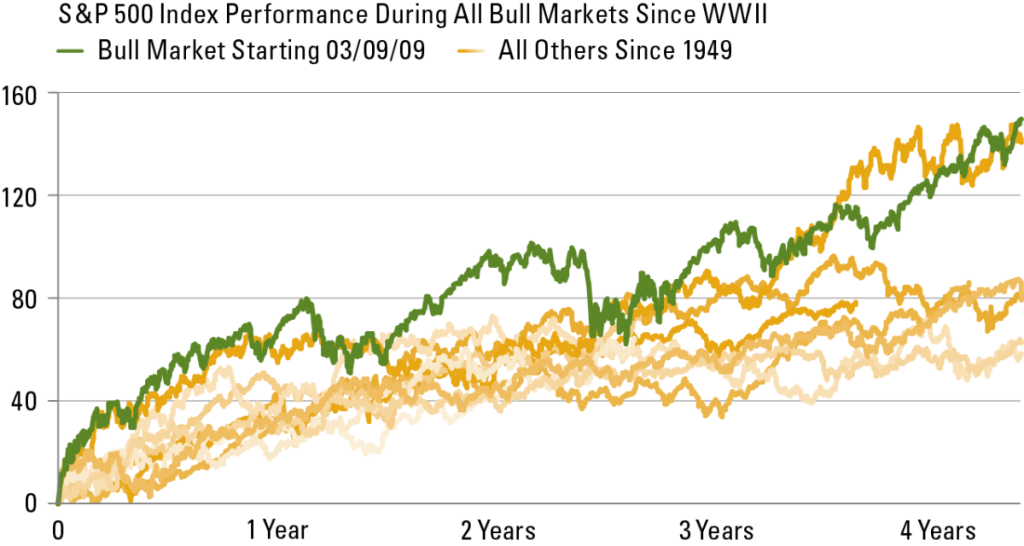
The current bull market that began in March 2009 is the strongest bull market recorded by the S&P 500 since the end of World War II (see green line in chart above).

The market has accomplished this achievement despite a litany of negatives,

  •        Fiscal cliff tax increases;
  •        Sequester spending cuts;
  •        High oil prices;
  •        Italian election debacle;
  •        Cyprus bank bailout;
  •        Weakening Chinese economic growth;
  •        Federal Reserve communicating the intention to end quantitative easing (QE);
  •        Downward revisions to earnings growth estimates;
  •        Rising interest rates;
  •        A rise in geopolitical risk from North Korea, Egypt, and Syria; and
  •       Bouts of defensive sector market leadership and weak trading volume.

Sources:
Chart o’ the Day: Strongest Bull Market In 65 Years
What’s Powering the Strongest Bull Market Since WWII?


Dow at All-Time High: What Has Changed?

  • March 7, 2013/
  • Posted By : admin/
  • 0 comments /
  • Under : Economy, Market Outlook

Click for larger view

The Dow climbed to 14253.77 on Tuesday to set a new all-time high. The economic landscape has changed a great deal since the previous record was set in October 2007:

  • GDP Growth: Then +2.5%; Now +1.6%
  • Unemployed: Then 6.7 million; Now 13.2 million
  • Food Stamp users: Then 26.9 million; Now 47.69 million
  • Fed’s Balance Sheet: Then $0.89 trillion; Now $3.01 trillion
  • Debt as a Percentage of GDP: Then ~38%; Now 74.2%
  • Total US Debt: Then $9.008 trillion; Now $16.43 trillion
  • Consumer Confidence: Then 99.5; Now 69.6
  • VIX: Then 17.5%; Now 14%
  • 10 Year Treasury Yield: Then 4.64%; Now 1.89%
  • Gold: Then $748; Now $1583
  • NYSE Average daily volume: Then 1.3 billion shares; Now 545 million shares

Source: WSJ


Do I need to worry about the “fiscal cliff”?

  • December 13, 2012/
  • Posted By : admin/
  • 0 comments /
  • Under : Economy, Market Outlook, Seeking Prudent Advice

This is a frequent question that we have heard from our clients and friends lately.  Do I need to worry about the “fiscal cliff”?

We don’t think the fiscal cliff represents a long-term concern to investors’ portfolios. The market may make a temporary move down if a compromise is not reached before January 1st. However, an agreement is inevitable and the market should move forward with renewed confidence.

There are so many unknowns involved that the best course of action is likely no action at all. We are not making any special changes to our NorthStar client portfolios (FYI: our stock portfolio is up over 30% YTD for 2012; see details and performance disclosures).

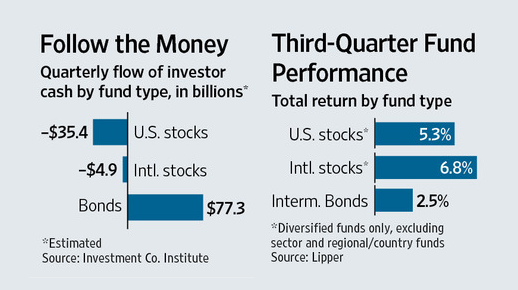
It’s interesting to note that retail investors (aka individual, “mom and pop” investors) have been selling and fleeing the market in response to the fiscal cliff hype-a-palooza. Meanwhile, professional investors (institutions and hedge funds) have been strong buyers.  See the chart below.


Investors Continue to Avoid Stocks Despite Strong Performance

  • October 4, 2012/
  • Posted By : admin/
  • 0 comments /
  • Under : Behavior, Market Outlook, Mutual Funds

The recent buoyancy in the stock market hasn’t won over mutual-fund buyers. August marked the 16th consecutive month in which investors pulled more cash out of U.S.-stock mutual funds than they put in.

The painful bear market of 2007-09 has left investors with a skewed view of U.S.-stock performance. In investor surveys conducted in early 2010, 2011 and 2012, at least 48% of respondents each year said the stock market had been down or flat in the preceding year. In fact, the Standard & Poor’s 500-stock index was up strongly in 2009 and 2010 and eked out a 2.1% return (including dividends) in 2011.

source: Wall Street Journal


Are You Better Off? Take a Look at the Stock Market

  • September 14, 2012/
  • Posted By : admin/
  • 0 comments /
  • Under : Behavior, Economy, Market Outlook, Performance

Are you better off now?  This is not meant as a political question.  We’re actually trying to make an important point regarding investor behavior.

As of September 14, the S&P 500 index with dividends is 87% higher than it was on inauguration day, January 19, 2009.

This fact shocks many people because it’s just hard to believe given the financial fallout of the Great Recession and the ensuing slow recovery.  As humans we tend to be backward looking.  The pain we experienced collectively and personally persists.  However, the stock market is focused on the future and investors judge the long-run prospects of the entire U.S. economy to be strong.

Bottom line:  Your personal experience, economic opinions, and intuition are often a poor guide to managing your investments. 

For example, is your stock portfolio up 87% as well or did you invest emotionally and cash out at the depths of the Great Recession?


Best Stock Market Rally Since WWII

  • September 7, 2012/
  • Posted By : admin/
  • 0 comments /
  • Under : Behavior, Market Outlook, Performance

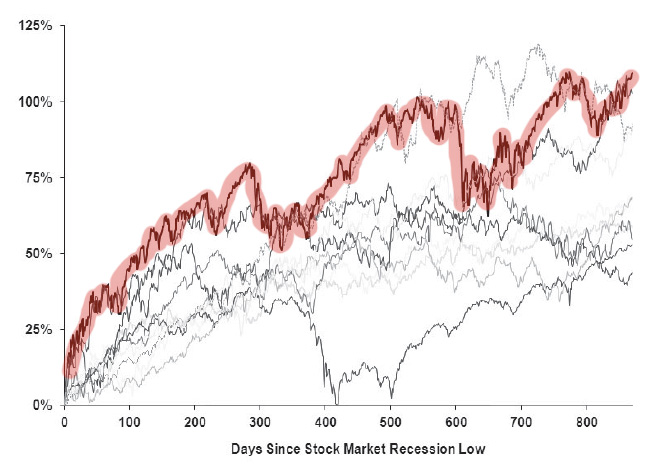
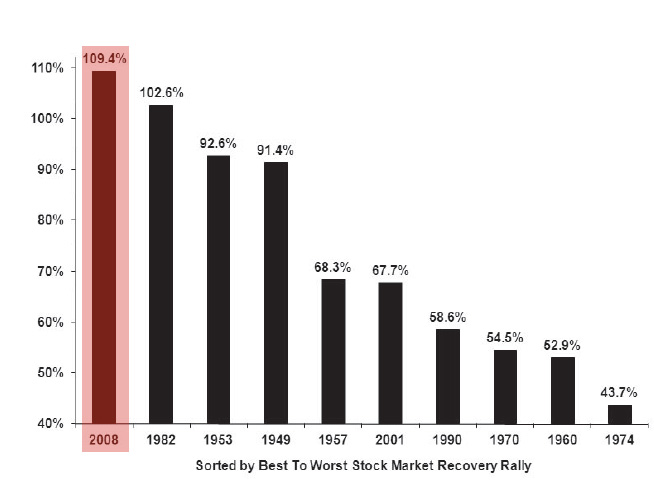
The current stock market recovery came out of the Great Recession of 2008 and is now more than 3 years old.  Despite the persistent worry and extreme caution of investors, this is one of the strongest stock market recoveries since World War II.  The charts below demonstrate not only is the current stock market recovery the best ever this far into the economic recovery, but nearly the best through out the entire recovery cycle.

Post-War Stock Market Rallies — Cumulative Return from Recession Low
(red highlight denotes current recovery stock market rally)

Post-War Stock Market Rallies — Cum Return from Recession Low to 870 Days
(red highlight denotes current recovery stock market rally)
Source:
Wells Capital Management
BEST EVER Post-War Stock Market Rally!
August 20, 2012

The Thundering Herd Cometh in 2011?

  • October 25, 2010/
  • Posted By : admin/
  • 0 comments /
  • Under : Market Outlook

Though we largely advise our clients to avoid market timing, the rest of herd may be returning to the market soon…”In 2011, strategists expect the stock market to notch double-digit gains and recommend investors boost allocations to ride the wave”

For Many Market Strategists, Equities Are Top Dog Againhttp://finance.yahoo.comAsset allocation strategists haven’t had an easy time in recent years. They’ve grappled with deflation, recession, plummeting U.S. stock markets and surging foreign economies. And for awhile they dished out bigger weightings to defensive plays-bonds, cash and commodities.

Physicist Leads Flash Crash Investigation

  • September 24, 2010/
  • Posted By : admin/
  • 0 comments /
  • Under : Market Outlook, Seeking Prudent Advice

NorthStar Capital Advisors was founded by a group of astrophysicists. So it warms our hearts to see another trained physicist successfully applying his analytical skills to bring stability and insight to the financial markets.

Ex-Physicist Leads Flash Crash Inquiry
The New York Times


The Great Recession: December 2007 ~ June 2009

  • September 24, 2010/
  • Posted By : admin/
  • 0 comments /
  • Under : Market Outlook

The Great Recession is official in the record books. The 18-month recession began in December 2007 and ended in June 2009. This was the longest slump since the Great Depression according to National Bureau of Economic Research’s Business Cycle Dating Committee, a group of academic economists that determines these benchmarks.

Great Recession


12345
Recent Posts
  • What the Fed sees…and why it matters September 2,2025
  • New Tax Law: 7 Big Changes You Should Know About August 1,2025
  • Markets at All-Time Highs: What Should You Do Now? July 1,2025
  • Thoughts on the shifting housing market June 5,2025
  • The patience premium: What market history teaches us May 1,2025
Archives
  • September 2025
  • August 2025
  • July 2025
  • June 2025
  • May 2025
  • April 2025
  • March 2025
  • February 2025
  • January 2025
  • December 2024
  • November 2024
  • October 2024
  • September 2024
  • August 2024
  • July 2024
  • June 2024
  • May 2024
  • April 2024
  • March 2024
  • February 2024
  • January 2024
  • December 2023
  • November 2023
  • October 2023
  • September 2023
  • August 2023
  • June 2023
  • May 2023
  • April 2023
  • March 2023
  • February 2023
  • January 2023
  • November 2022
  • October 2022
  • September 2022
  • August 2022
  • July 2022
  • May 2022
  • April 2022
  • March 2022
  • February 2022
  • December 2021
  • October 2021
  • September 2021
  • August 2021
  • July 2021
  • June 2021
  • May 2021
  • April 2021
  • March 2021
  • February 2021
  • January 2021
  • December 2020
  • November 2020
  • October 2020
  • September 2020
  • August 2020
  • July 2020
  • June 2020
  • May 2020
  • April 2020
  • March 2020
  • November 2019
  • October 2019
  • June 2019
  • May 2019
  • April 2019
  • March 2019
  • February 2019
  • January 2019
  • December 2018
  • November 2018
  • October 2018
  • September 2018
  • August 2018
  • July 2018
  • June 2018
  • May 2018
  • April 2018
  • March 2018
  • February 2018
  • January 2018
  • December 2017
  • November 2017
  • October 2017
  • September 2017
  • August 2017
  • July 2017
  • June 2017
  • May 2017
  • April 2017
  • March 2017
  • February 2017
  • January 2017
  • December 2016
  • November 2016
  • October 2016
  • September 2016
  • August 2016
  • July 2016
  • June 2016
  • May 2016
  • April 2016
  • March 2016
  • February 2016
  • January 2016
  • December 2015
  • November 2015
  • October 2015
  • September 2015
  • August 2015
  • July 2015
  • June 2015
  • May 2015
  • April 2015
  • March 2015
  • February 2015
  • January 2015
  • December 2014
  • November 2014
  • October 2014
  • September 2014
  • August 2014
  • July 2014
  • June 2014
  • May 2014
  • April 2014
  • March 2014
  • February 2014
  • January 2014
  • December 2013
  • November 2013
  • October 2013
  • September 2013
  • August 2013
  • July 2013
  • June 2013
  • May 2013
  • April 2013
  • March 2013
  • February 2013
  • January 2013
  • December 2012
  • November 2012
  • October 2012
  • September 2012
  • August 2012
  • July 2012
  • June 2012
  • May 2012
  • April 2012
  • March 2012
  • February 2012
  • January 2012
  • December 2011
  • November 2011
  • October 2011
  • September 2011
  • August 2011
  • July 2011
  • June 2011
  • May 2011
  • April 2011
  • March 2011
  • February 2011
  • January 2011
  • November 2010
  • October 2010
  • September 2010
  • August 2010
Categories
  • 401(k)
  • Annuities
  • Behavior
  • Best Practices
  • Bonds
  • Charitable Donations
  • Economy
  • Fees
  • Fiduciary
  • Financial Planning
  • Investing 101
  • Live Well
  • Market Outlook
  • Mutual Funds
  • NorthStar
  • Performance
  • Personal Finance
  • Planning
  • Retirement
  • Saving Money
  • Scams & Schemes
  • Seeking Prudent Advice
  • Tax Planning
  • Uncategorised
  • Uncategorized
  • Weekly Market Review
ABOUT US

We are a fee-only, independent fiduciary advisor. Our allegiance rests solely with our clients and their best interests. We are headquartered in Charlotte, North Carolina and serve client families across the nation.


CLIENT TOOLS
CONTACT
  • (704) 350-5028
  • info@nstarcapital.com
  • 521 East Blvd, Charlotte, NC 28203
    (by appointment only)
  • fax: (704) 626-3462
FROM OUR BLOG
  • What the Fed sees…and why it matters September 2,2025
  • New Tax Law: 7 Big Changes You Should Know About August 1,2025
  • Markets at All-Time Highs: What Should You Do Now? July 1,2025
Nothing on this website constitutes either the provision of investment advice or solicitation to provide investment advice.
Investment advice can only be provided through a formal investment advisory relationship.