Dow at All-Time High: What Has Changed?
The Dow climbed to 14253.77 on Tuesday to set a new all-time high. The economic landscape has changed a great deal since the previous record was set in October 2007:
- GDP Growth: Then +2.5%; Now +1.6%
- Unemployed: Then 6.7 million; Now 13.2 million
- Food Stamp users: Then 26.9 million; Now 47.69 million
- Fed’s Balance Sheet: Then $0.89 trillion; Now $3.01 trillion
- Debt as a Percentage of GDP: Then ~38%; Now 74.2%
- Total US Debt: Then $9.008 trillion; Now $16.43 trillion
- Consumer Confidence: Then 99.5; Now 69.6
- VIX: Then 17.5%; Now 14%
- 10 Year Treasury Yield: Then 4.64%; Now 1.89%
- Gold: Then $748; Now $1583
- NYSE Average daily volume: Then 1.3 billion shares; Now 545 million shares
Source: WSJ
Do I need to worry about the “fiscal cliff”?
This is a frequent question that we have heard from our clients and friends lately. Do I need to worry about the “fiscal cliff”?
We don’t think the fiscal cliff represents a long-term concern to investors’ portfolios. The market may make a temporary move down if a compromise is not reached before January 1st. However, an agreement is inevitable and the market should move forward with renewed confidence.
There are so many unknowns involved that the best course of action is likely no action at all. We are not making any special changes to our NorthStar client portfolios (FYI: our stock portfolio is up over 30% YTD for 2012; see details and performance disclosures).
It’s interesting to note that retail investors (aka individual, “mom and pop” investors) have been selling and fleeing the market in response to the fiscal cliff hype-a-palooza. Meanwhile, professional investors (institutions and hedge funds) have been strong buyers. See the chart below.
Fiscal Cliff’s Jagged Edge
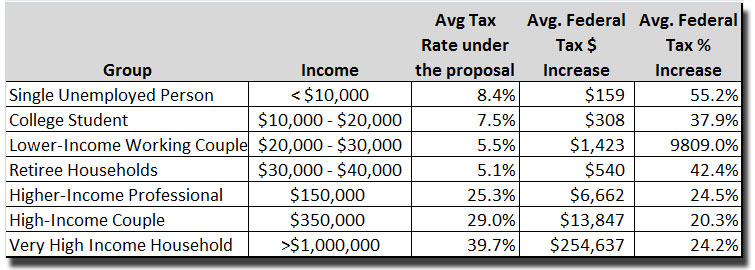
 If Washington can’t end the budget dilemma by year-end, most households will be impacted by the “fiscal cliff”.
As the table below shows, lower-income people would see the steepest tax increases in percentage terms. For example, an average married couple making $20,000 to $30,000 would see their tax go up $1,423, from receiving a $15 refund to paying $1,408.
Here are the key drivers behind the tax increase broken out by group:
- Single unemployed person: loss of benefits
- College student: loss of education breaks as well as the payroll tax holiday
- Lower-income working couple: loss of Bush-era 10% bracket, loss of relief from so-called marriage penalty and the reduction of the child credit
- Retiree households: loss of Bush-era tax rates
- Higher income professional: loss of protection from the alternative minimum tax (AMT)
- High-income couple: disappearance of Bush-era tax cuts & AMT relief plus higher taxes on investments
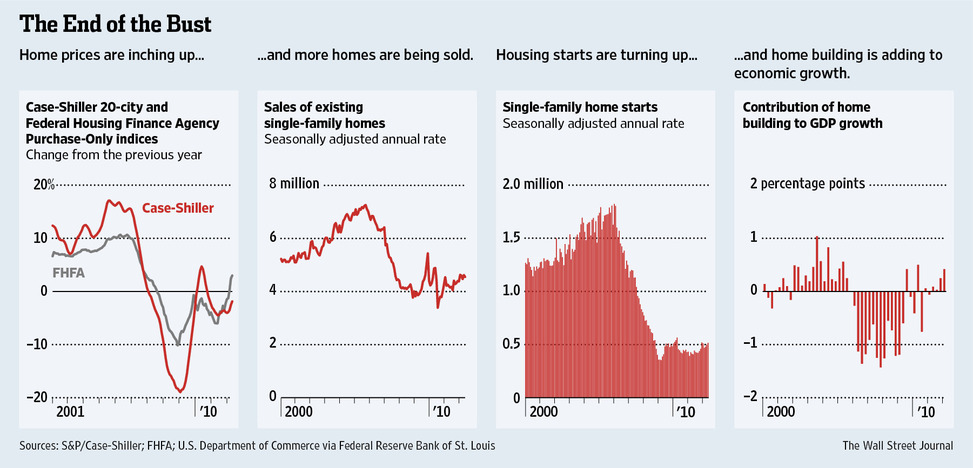
Home Building Surges as Confidence Grows
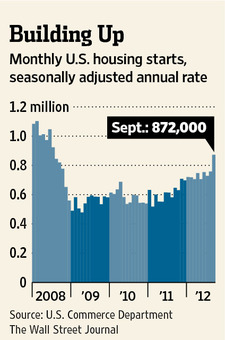 Residential construction picked up momentum in September and now is running at its highest level in four years, a turn that could have a positive effect on the jobs market and the broader U.S. economy.
Source:
Wall Street Journal
Are You Better Off? Take a Look at the Stock Market
 Are you better off now? This is not meant as a political question. We’re actually trying to make an important point regarding investor behavior.
As of September 14, the S&P 500 index with dividends is 87% higher than it was on inauguration day, January 19, 2009.
This fact shocks many people because it’s just hard to believe given the financial fallout of the Great Recession and the ensuing slow recovery. As humans we tend to be backward looking. The pain we experienced collectively and personally persists. However, the stock market is focused on the future and investors judge the long-run prospects of the entire U.S. economy to be strong.
Bottom line: Your personal experience, economic opinions, and intuition are often a poor guide to managing your investments.
For example, is your stock portfolio up 87% as well or did you invest emotionally and cash out at the depths of the Great Recession?
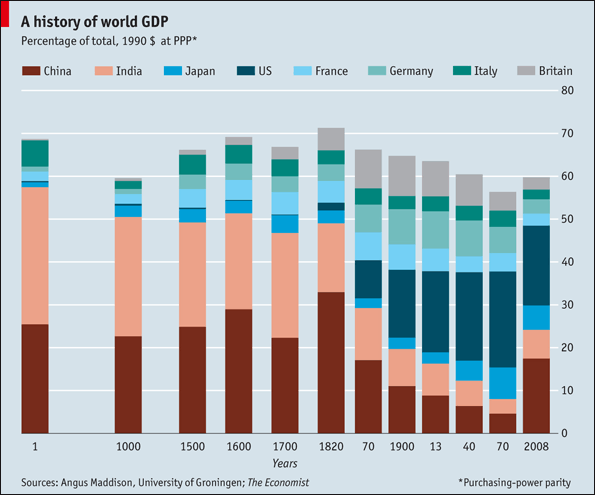
2,000 Years of Economic History in One Chart
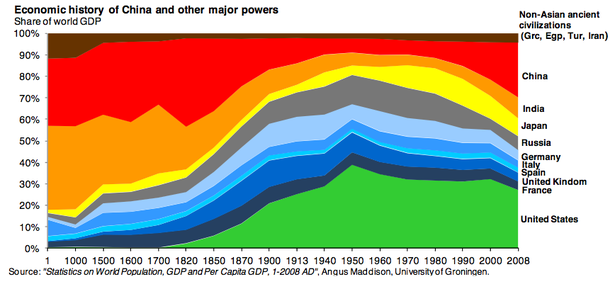 The fascinating graph above represents 2,000 years of economic history starting in 1 AD. It was produced by Michael Cembalest, head of investment strategy at JP Morgan.
The ebb and flow of economic dominance is interesting. India (orange) and China (red) dominated for roughly 1800 years. However, they were pushed aside by growth in the United States (green), Western Europe (shades of blue), and Japan (yellow) which peaked by 1950. Since then China has surged back toward a larger role.
The Economist published a different rendition that gives the time sampling on the x-axis a more rigorous treatment:
Oh Baby! You’re Expensive
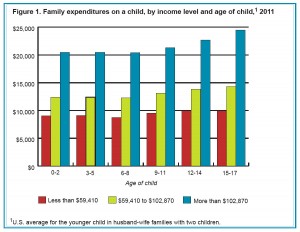
 Many parents worry about saving for college, but don’t forget about the proceeding 17 years! Food, clothing, shelter, and other necessities will cost $234,900 for a child born in 2011 to a middle-income family.
Today the the U.S. Department of Agriculture released their annual report where they total up the cost that parents pay to raise a child from birth to age 17.
- The annual expense per child ranges from $8,760 to $9,970 on average (depending on age) for households with an annual income less than $59,410.
- The annual cost increases to $12,290 to $14,320 for households with income up to $102,870.
- The annual cost increases yet again to $20,420 to $24,510 for households with annual income greater than $102,870.
Housing, childcare & education, and food comprise 64% of the expenses.
It’s interesting to compare the costs of raising a child born in 1960 (the year the USDA study first started) to a child of 2011. The total cost has increased 22% from $191,723 in 1960 (in 2011 dollars) to $234,900 in 2011.
- Food has decreased from 24% of the cost in 1960 to 16% in 2011
- Clothing has shrunk from 11% in 1960 to 6% in 2011
- Childcare & education has surged from only 2% in 1960 to 18% in 2011
- Healthcare has doubled from 4% in 1960 to 8% in 2011
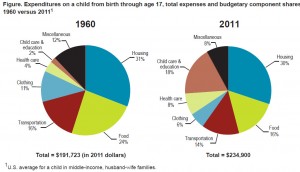
Expenditures on a child from birth through age 17, total expenses and budgetary component shares, 1960 versus 2011 (CLICK TO ENLARGE)
Recent Posts
-
Can stocks go higher? April 3,2024
-
Does the Fed really matter? March 2,2024
-
Bull market confirmed! What happens next February 2,2024
-
Is inflation rising again? January 17,2024
-
What does 2024 have in store? December 7,2023
Archives
- April 2024
- March 2024
- February 2024
- January 2024
- December 2023
- November 2023
- October 2023
- September 2023
- August 2023
- June 2023
- May 2023
- April 2023
- March 2023
- February 2023
- January 2023
- November 2022
- October 2022
- September 2022
- August 2022
- July 2022
- May 2022
- April 2022
- March 2022
- February 2022
- December 2021
- October 2021
- September 2021
- August 2021
- July 2021
- June 2021
- May 2021
- April 2021
- March 2021
- February 2021
- January 2021
- December 2020
- November 2020
- October 2020
- September 2020
- August 2020
- July 2020
- June 2020
- May 2020
- April 2020
- March 2020
- February 2020
- November 2019
- October 2019
- June 2019
- May 2019
- April 2019
- March 2019
- February 2019
- January 2019
- December 2018
- November 2018
- October 2018
- September 2018
- August 2018
- July 2018
- June 2018
- May 2018
- April 2018
- March 2018
- February 2018
- January 2018
- December 2017
- November 2017
- October 2017
- September 2017
- August 2017
- July 2017
- June 2017
- May 2017
- April 2017
- March 2017
- February 2017
- January 2017
- December 2016
- November 2016
- October 2016
- September 2016
- August 2016
- July 2016
- June 2016
- May 2016
- April 2016
- March 2016
- February 2016
- January 2016
- December 2015
- November 2015
- October 2015
- September 2015
- August 2015
- July 2015
- June 2015
- May 2015
- April 2015
- March 2015
- February 2015
- January 2015
- December 2014
- November 2014
- October 2014
- September 2014
- August 2014
- July 2014
- June 2014
- May 2014
- April 2014
- March 2014
- February 2014
- January 2014
- December 2013
- November 2013
- October 2013
- September 2013
- August 2013
- July 2013
- June 2013
- May 2013
- April 2013
- March 2013
- February 2013
- January 2013
- December 2012
- November 2012
- October 2012
- September 2012
- August 2012
- July 2012
- June 2012
- May 2012
- April 2012
- March 2012
- February 2012
- January 2012
- December 2011
- November 2011
- October 2011
- September 2011
- August 2011
- July 2011
- June 2011
- May 2011
- April 2011
- March 2011
- February 2011
- January 2011
- November 2010
- October 2010
- September 2010
- August 2010
Categories
- 401(k)
- Annuities
- Behavior
- Best Practices
- Bonds
- Charitable Donations
- Economy
- Fees
- Fiduciary
- Financial Planning
- Investing 101
- Live Well
- Market Outlook
- Mutual Funds
- NorthStar
- Performance
- Personal Finance
- Planning
- Retirement
- Saving Money
- Scams & Schemes
- Seeking Prudent Advice
- Tax Planning
- Uncategorised
- Uncategorized
- Weekly Market Review


