NorthStar Capital AdvisorsNorthStar Capital AdvisorsNorthStar Capital AdvisorsNorthStar Capital Advisors
Start Here
  • How We Help
  • Who We Serve
  • Who We Are
  • Fiduciary
  • Learning
  • Start Here
  • How We Help
  • Who We Serve
  • Who We Are
  • Fiduciary
  • Learning
  • Start Here

Market Timing & Emotions ~ Afflictions of the Average Investor

  • January 16, 2014/
  • Posted By : admin/
  • 0 comments /
  • Under : Behavior, Performance, Personal Finance, Seeking Prudent Advice
investor-results

Click to enlarge

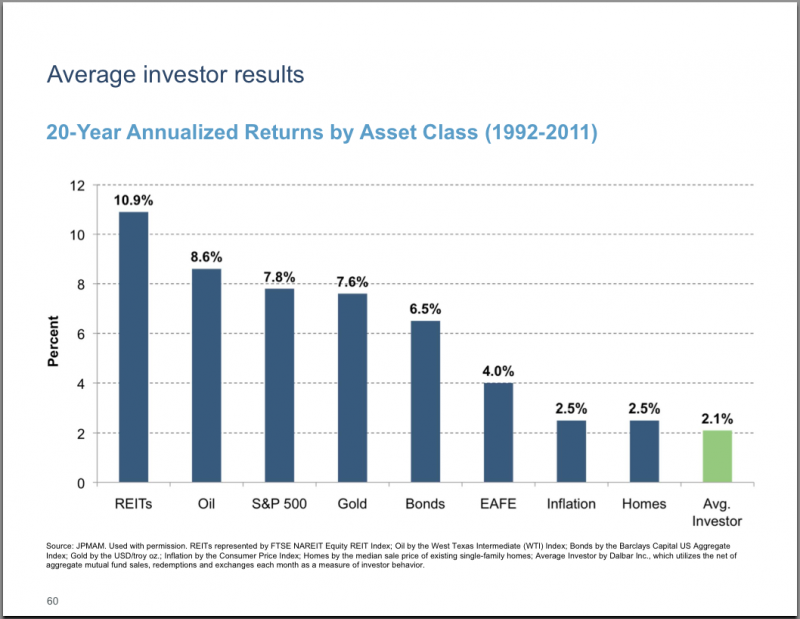
This chart of 20 years of market data vividly demonstrates a painful lesson.  The average investor* badly trails all classes of investment assets.

The primary culprit for this deficit is ill-fated attempts to time the market and emotionally driven decisions to move in and out of the markets.

Most individuals claim to be long-term investor until their portfolio drops 10% and suddenly there’s panic.

Our primary role as an investment advisor is to help our clients have the discipline to ignore the gyrations of the markets and keep the long view when it comes to their investments.

* Average investor refers to individual investors across the United States


North Carolina Stocks Were Strong Performers in 2013

  • January 9, 2014/
  • Posted By : admin/
  • 0 comments /
  • Under : Performance

north_carolina_flagThe fifty largest publicly traded companies headquartered in North Carolina fared very well overall in the 2013 stock market.  The Tarheel group gained 28.3%,  comparable to the 29.6% put up by the S&P 500.

Note the 2013 returns were much larger than the long-term average.

These NC stocks have return 12.3% per year over the last 5 years, far outperforming the S&P 500 which delivered only 4.8% over the same time period (2008-2013).

North Carolina’s 50 largest publicly traded companies, excluding companies that went public during the year. They are in order by annual revenue.

Company Headquarters 2013 close 2012 close 2008 close 1-year return 5-year return
Bank of America Corp. Charlotte $15.57 $11.61 $14.08 34% 11%
Lowe’s Cos. Inc. Mooresville $49.55 $35.52 $21.52 39% 130%
Duke Energy Corp. Charlotte $69.01 $63.80 $45.03 8% 53%
Nucor Corp. Charlotte $53.38 $43.16 $46.20 24% 16%
VF Corp. Greensboro $62.34 $37.74 $13.69 65% 355%
BB&T Corp. Winston-Salem $37.32 $29.11 $27.46 28% 36%
Family Dollar Stores Matthews $64.97 $63.41 $26.07 2% 149%
Sonic Automotive Inc. Charlotte $24.48 $20.89 $3.98 17% 515%
Reynolds American Inc. Winston Salem $49.99 $41.43 $20.16 21% 148%
Pantry Inc. Cary $16.78 $12.13 $21.45 38% -22%
Laboratory Corp. of America Burlington $91.37 $86.62 $64.41 5% 42%
SPX Corp. Charlotte $99.61 $70.15 $40.55 42% 146%
Lorillard Inc. Greensboro $50.68 $38.89 $18.78 30% 170%
Harris Teeter Supermarkets Matthews $49.35 $38.56 $27.65 28% 78%
Hanesbrands Inc. Winston Salem $70.27 $35.82 $12.75 96% 451%
Ingles Markets Inc. Black Mountain $27.10 $17.26 $17.59 57% 54%
Carlisle Cos. Inc. Charlotte $79.40 $58.76 $20.70 35% 284%
Babcock & Wilcox Co. Charlotte $34.19 $26.20 N.A. 30% N.A.
Chiquita Brands International Charlotte $11.70 $8.25 $14.78 42% -21%
Alliance One International Morrisville $3.05 $3.64 $2.94 -16% 4%
Old Dominion Freight Line Thomasville $53.02 $34.28 $12.65 55% 319%
Martin Marietta Materials Raleigh $99.94 $94.28 $97.08 6% 3%
Snyders-Lance Inc. Charlotte $28.66 $24.12 $22.94 19% 25%
Coca-Cola Bottling Co. Charlotte $73.19 $66.50 $45.96 10% 59%
Cree Inc. Durham $56.04 $52.96 $13.22 6% 324%
Fresh Market Inc. Greensboro $62.52 $33.98 $15.87 84% 294%
Red Hat Inc. Raleigh $40.50 $48.09 N.A. -16% N.A.
Piedmont Natural Gas Co. Charlotte $33.16 $31.31 $31.67 6% 5%
RF Micro Devices Inc. Greensboro $5.16 $4.48 $0.78 15% 562%
EnPro Industries Inc. Charlotte $57.65 $40.90 $21.54 41% 168%
First Citizens Bancshares Raleigh $222.63 $163.50 $152.80 36% 46%
Horizon Lines Inc. Charlotte $0.84 $1.50 $87.25 -44% -99%
Fairpoint Communications Inc. Charlotte $11.31 $7.95 N.A. 42% N.A.
Cato Corp. Charlotte $31.80 $27.43 $15.10 16% 111%
Salix Pharmaceuticals Ltd. Raleigh $89.94 $40.47 $8.83 122% 919%
Pike Corp. Mount Airy $10.57 $9.55 $12.30 11% -14%
Unifi Inc. Greensboro $27.24 $13.01 $8.46 109% 222%
Polypore International Inc. Charlotte $38.90 $46.50 $7.56 -16% 415%
Highwoods Properties Inc. Raleigh $36.17 $33.45 $27.36 8% 32%
Xerium Technologies Inc. Raleigh $16.49 $3.05 $13.20 441% 25%
Speedway Motorsports Inc. Concord $19.85 $17.84 $16.11 11% 23%
Krispy Kreme Doughnuts Inc. Winston-Salem $19.29 $9.38 $1.68 106% 1048%
Tanger Factory Outlet Centers Inc. Greensboro $32.02 $34.20 $18.81 -6% 70%
Insteel Industries Inc. Mount Airy $22.73 $12.48 $11.29 82% 101%
Culp Inc. High Point $20.45 $15.01 $1.98 36% 933%
Powersecure International Inc. Wake Forest $17.17 $7.81 $3.29 120% 422%
Hatteras Financial Corp. Winston-Salem $16.34 $24.81 $26.60 -34% -39%
Swisher Hygiene Inc. Charlotte $0.55 $1.73 $0.37 -68% 49%
Triad Guaranty Inc. Winston-Salem $0.27 $0.07 $0.38 286% -29%
Cornerstone Therapeutics Inc. Cary $9.49 $4.73 $2.65 101% 258%
 
NC 50 OVERALL 28.3% 12.3%
S&P 500 29.6% 4.8%
  annualized

source: Charlotte Observer


All 10 Stock Sectors Post Gains in Big Year

  • January 2, 2014/
  • Posted By : admin/
  • 0 comments /
  • Under : Performance
stocksectors2013

Click to enlarge

All 10 of the S&P 500’s stock sectors finished 2013 in positive territory. Stocks most closely tied to economic growth fared best in 2013, while those typically regarded as the safest bets logged the year’s smallest gains.

Source: WSJ


Annual Returns by Asset Class

  • August 8, 2013/
  • Posted By : admin/
  • 0 comments /
  • Under : Market Outlook, Performance

These charts show how different asset classes rank each year over the past 10 years (best performers on top).  This is an excellent demonstration of how hard it is to predict the future and how often the least-popular investments outperform common expectations.

Click to enlarge

Click to enlarge

Source: J.P. Morgan


The Cost Of Sitting On Cash

  • August 1, 2013/
  • Posted By : admin/
  • 0 comments /
  • Under : Market Outlook, Performance

According to the latest financial security index by Bankrate.com, here’s how Americans prefer to invest money that they don’t need for more than 10 years:

26% say they prefer cash for long-term investments.  Cash is arguably a great place to store your wealth briefly, however 80 years of data show cash is a horrible long-term investment. 

The following chart shows that cash has averaged a negative real, after-tax return (be sure to click on the chart for a closer look).  Inflation and taxes are killers.

Click to enlarge

“Americans not saving enough is well-documented, but hunkering down in cash investments and settling for low returns will only magnify the problem of not having a sufficient nest egg to meet longer-range financial goals such as retirement,” said Greg McBride, CFA, Bankrate.com’s senior financial analyst. “Other choices may not do the trick either, as real estate is not only very cash-intensive, but often illiquid. And precious metals spit out zero cash flows, with gains solely dependent on price appreciation.”
Sources:
BankRate.com
BlackRock

Are You Better Off? Take a Look at the Stock Market

  • September 14, 2012/
  • Posted By : admin/
  • 0 comments /
  • Under : Behavior, Economy, Market Outlook, Performance

Are you better off now?  This is not meant as a political question.  We’re actually trying to make an important point regarding investor behavior.

As of September 14, the S&P 500 index with dividends is 87% higher than it was on inauguration day, January 19, 2009.

This fact shocks many people because it’s just hard to believe given the financial fallout of the Great Recession and the ensuing slow recovery.  As humans we tend to be backward looking.  The pain we experienced collectively and personally persists.  However, the stock market is focused on the future and investors judge the long-run prospects of the entire U.S. economy to be strong.

Bottom line:  Your personal experience, economic opinions, and intuition are often a poor guide to managing your investments. 

For example, is your stock portfolio up 87% as well or did you invest emotionally and cash out at the depths of the Great Recession?


Best Stock Market Rally Since WWII

  • September 7, 2012/
  • Posted By : admin/
  • 0 comments /
  • Under : Behavior, Market Outlook, Performance

The current stock market recovery came out of the Great Recession of 2008 and is now more than 3 years old.  Despite the persistent worry and extreme caution of investors, this is one of the strongest stock market recoveries since World War II.  The charts below demonstrate not only is the current stock market recovery the best ever this far into the economic recovery, but nearly the best through out the entire recovery cycle.

Post-War Stock Market Rallies — Cumulative Return from Recession Low
(red highlight denotes current recovery stock market rally)

Post-War Stock Market Rallies — Cum Return from Recession Low to 870 Days
(red highlight denotes current recovery stock market rally)
Source:
Wells Capital Management
BEST EVER Post-War Stock Market Rally!
August 20, 2012

Staying the course pays off for investors

  • June 16, 2011/
  • Posted By : admin/
  • 0 comments /
  • Under : Performance, Seeking Prudent Advice

Time heals financial wounds: Holding stocks for 20 years can turn bad returns to good 

  • Historical data compiled by Oppenheimer show that stocks have not suffered an average annualized loss in a 20-year holding period (measured in rolling monthly periods) since 1950.
  • “Historical evidence suggests that longer investment horizons typically produce better results,” says Oppenheimer’s chief investment strategist Brian Belski.
  • “The lesson here is: Chill, stay invested, stay disciplined and be diversified,” Belski said.
  • Much of individual investors’ lagging performance is blamed on psychological factors. More often than not, they buy high and sell low rather than the classic winning strategy of buy low and sell high. Put another way, they sell the dips, rather than buy the dips.
  • “Fear,” Harvey said, often prompts investors to bail out of stocks after prices have fallen far and the worst of the decline is over. They make matters worse “by delaying getting back in” early enough to participate in the eventual recovery.
  • A key reason why investors who stay the course end up doing well is the fact that stocks go up roughly two-thirds of the time.

Read more in this article:

Staying the course pays off for investors | FLORIDA TODAY | floridatoday.com

Staying the course pays off for investors | FLORIDA TODAY | floridatoday.comhttp://www.floridatoday.comThe long term used to mean three-, five- or 10-year holding periods for stock investors looking to wring out risk and boost their odds of making money. Then came the 2000s, dubbed the Lost Decade, when the U.S. stock market posted negative returns in a decade for the first time since the 1930s.

Beware Top Funds With Poor Investor Returns

  • May 26, 2011/
  • Posted By : admin/
  • 0 comments /
  • Under : Performance, Seeking Prudent Advice

Investor Return versus Fund Return

  1. Investor return can be very different from the widely quoted figures for total fund return.
  2. For example, the top-rated Fidelity Leveraged Stock fund has an annual return over the last 10-year period of 14.5%.  However, the average investor in this fund had an average annual return of only 4.0%.
  3. The reason for the gap is, most investors didn’t buy and hold for the 10 years. Instead, the average dollar in the portfolio stayed invested for short periods.
  4. Many studies have shown that long-term shareholders receive the best returns.

Learn more in this article:

Beware Top Funds With Poor Investor Returns – Yahoo! Financehttp://finance.yahoo.com/news/Beware-Top-Funds-With-Poor-tsmf-514712389.html?x=0If you invested in Fidelity Leveraged Stock a decade ago, your total annual return would have been 14.5%. But the typical shareholder had an investor return of only 4.0%. The reason for the gap is, most investors didn’t buy and hold for the 10 years. Instead, the average dollar in the portfolio…

Numbers You Can’t Count On

  • April 14, 2011/
  • Posted By : admin/
  • 0 comments /
  • Under : Mutual Funds, Performance, Seeking Prudent Advice

Five ways in which a fund’s impressive record vs. peers may not realy indicate much:

  1. The best performance came under a portfolio manager who is no longer with the fund
  2. The fund has become too large to efficiently invest in the market segment or style that produced its best results
  3. The fund invests differently than most of the others it is being compared to, so the peer group isn’t a good fit
  4. The fund has a flexible charter and tends to bounce among categories; its numbers look good in one category but look like a laggard in another
  5. The fund changed its investment mandate partway through the time period you are looking at

Learn more about how common measures of mutual-fund performance sometimes tell you a lot less than you might think in this Wall Street Journal article from Michael A. Polluck.

Mutual-Fund Performance Numbers May Tell You Less Than You Might Think - WSJ.com

Mutual-Fund Performance Numbers May Tell You Less Than You Might Think – WSJ.comhttp://online.wsj.comSome of the most common investor tools—from numbers of stars to comparisons with benchmarks—have quirks and limitations that can render them far less helpful than people think.


1234
Recent Posts
  • What the Fed sees…and why it matters September 2,2025
  • New Tax Law: 7 Big Changes You Should Know About August 1,2025
  • Markets at All-Time Highs: What Should You Do Now? July 1,2025
  • Thoughts on the shifting housing market June 5,2025
  • The patience premium: What market history teaches us May 1,2025
Archives
  • September 2025
  • August 2025
  • July 2025
  • June 2025
  • May 2025
  • April 2025
  • March 2025
  • February 2025
  • January 2025
  • December 2024
  • November 2024
  • October 2024
  • September 2024
  • August 2024
  • July 2024
  • June 2024
  • May 2024
  • April 2024
  • March 2024
  • February 2024
  • January 2024
  • December 2023
  • November 2023
  • October 2023
  • September 2023
  • August 2023
  • June 2023
  • May 2023
  • April 2023
  • March 2023
  • February 2023
  • January 2023
  • November 2022
  • October 2022
  • September 2022
  • August 2022
  • July 2022
  • May 2022
  • April 2022
  • March 2022
  • February 2022
  • December 2021
  • October 2021
  • September 2021
  • August 2021
  • July 2021
  • June 2021
  • May 2021
  • April 2021
  • March 2021
  • February 2021
  • January 2021
  • December 2020
  • November 2020
  • October 2020
  • September 2020
  • August 2020
  • July 2020
  • June 2020
  • May 2020
  • April 2020
  • March 2020
  • November 2019
  • October 2019
  • June 2019
  • May 2019
  • April 2019
  • March 2019
  • February 2019
  • January 2019
  • December 2018
  • November 2018
  • October 2018
  • September 2018
  • August 2018
  • July 2018
  • June 2018
  • May 2018
  • April 2018
  • March 2018
  • February 2018
  • January 2018
  • December 2017
  • November 2017
  • October 2017
  • September 2017
  • August 2017
  • July 2017
  • June 2017
  • May 2017
  • April 2017
  • March 2017
  • February 2017
  • January 2017
  • December 2016
  • November 2016
  • October 2016
  • September 2016
  • August 2016
  • July 2016
  • June 2016
  • May 2016
  • April 2016
  • March 2016
  • February 2016
  • January 2016
  • December 2015
  • November 2015
  • October 2015
  • September 2015
  • August 2015
  • July 2015
  • June 2015
  • May 2015
  • April 2015
  • March 2015
  • February 2015
  • January 2015
  • December 2014
  • November 2014
  • October 2014
  • September 2014
  • August 2014
  • July 2014
  • June 2014
  • May 2014
  • April 2014
  • March 2014
  • February 2014
  • January 2014
  • December 2013
  • November 2013
  • October 2013
  • September 2013
  • August 2013
  • July 2013
  • June 2013
  • May 2013
  • April 2013
  • March 2013
  • February 2013
  • January 2013
  • December 2012
  • November 2012
  • October 2012
  • September 2012
  • August 2012
  • July 2012
  • June 2012
  • May 2012
  • April 2012
  • March 2012
  • February 2012
  • January 2012
  • December 2011
  • November 2011
  • October 2011
  • September 2011
  • August 2011
  • July 2011
  • June 2011
  • May 2011
  • April 2011
  • March 2011
  • February 2011
  • January 2011
  • November 2010
  • October 2010
  • September 2010
  • August 2010
Categories
  • 401(k)
  • Annuities
  • Behavior
  • Best Practices
  • Bonds
  • Charitable Donations
  • Economy
  • Fees
  • Fiduciary
  • Financial Planning
  • Investing 101
  • Live Well
  • Market Outlook
  • Mutual Funds
  • NorthStar
  • Performance
  • Personal Finance
  • Planning
  • Retirement
  • Saving Money
  • Scams & Schemes
  • Seeking Prudent Advice
  • Tax Planning
  • Uncategorised
  • Uncategorized
  • Weekly Market Review
ABOUT US

We are a fee-only, independent fiduciary advisor. Our allegiance rests solely with our clients and their best interests. We are headquartered in Charlotte, North Carolina and serve client families across the nation.


CLIENT TOOLS
CONTACT
  • (704) 350-5028
  • info@nstarcapital.com
  • 521 East Blvd, Charlotte, NC 28203
    (by appointment only)
  • fax: (704) 626-3462
FROM OUR BLOG
  • What the Fed sees…and why it matters September 2,2025
  • New Tax Law: 7 Big Changes You Should Know About August 1,2025
  • Markets at All-Time Highs: What Should You Do Now? July 1,2025
Nothing on this website constitutes either the provision of investment advice or solicitation to provide investment advice.
Investment advice can only be provided through a formal investment advisory relationship.