Running in the Wrong Direction (CHART)
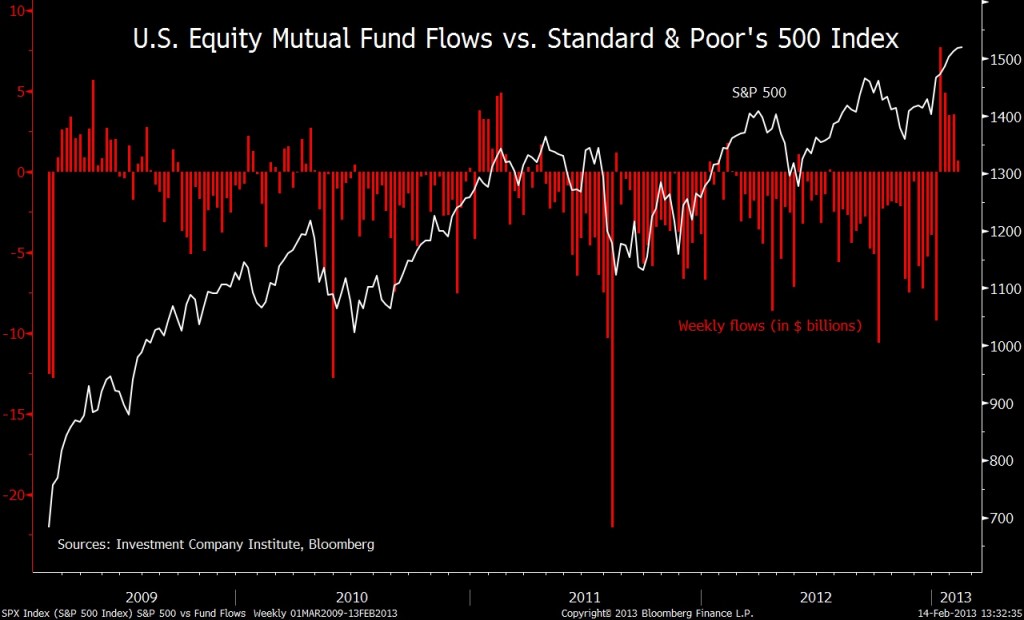
The S&P 500 has more than doubled since March 2009 but individual investors have been selling stocks almost the entire time!
In January 2013, equity funds took in $19.6 billion. This was the largest inflow since ICI started tracking the data six years ago. During the prior 4 year rally, outflows exceeded $435 billion.
This is a very visual example of how emotions can wreak havoc on an investor’s ability to build long-term wealth. Investors allowed fear to control their investing behavior and entirely miss this 4-year bull run.
This negative behavior is nothing new. Over the 20-year period from 1992 to 2011, the S&P 500 returned 7.8% annually, while the average stock investor in the U.S. earned only 3.5%.
Source:
David Wilson
Chart of the Day, February 14, 2013
Bloomberg


