Stock Market’s Merry Performance Over Time
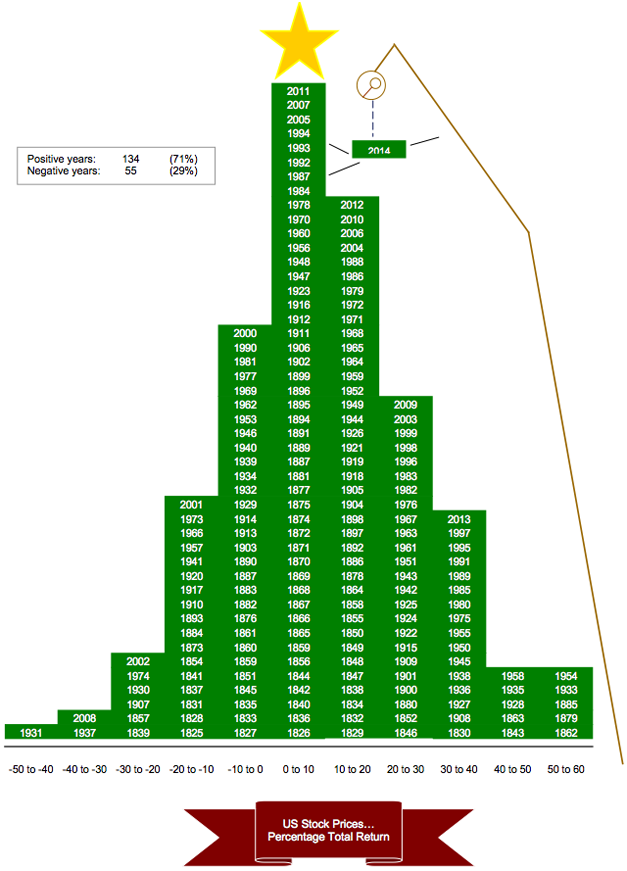
Above is Carter Braxton Worth’s seasonal interpretation of the stock market’s history. Stacking up the stock market’s annual performance going back nearly 200 years can look merry and bright.
Since 1825, the stock market has produced an annual gain 71% of the time, or 134 times, while losing ground just 55 times. A standard distribution chart, which happens to take the shape of a Christmas tree, shows how for most years, the market moves within a range of zero to up 10%.
Source: MarketWatch