Home Price Growth Cools Off
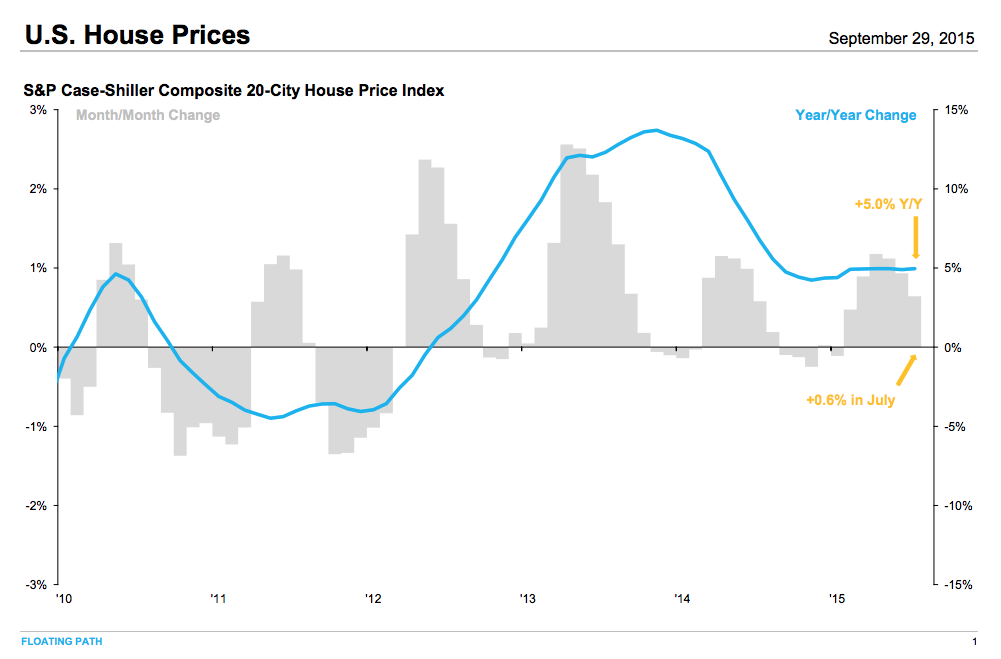
The pace of year-over-year home price growth is beginning to cool off according to this week’s 20-city Case-Shiller Housing Price Index which updates through the end of July. At a national level, home prices have seen an annual price increase of 5% year over year as of July 2015. However, that is way off the peak year-over-year growth of nearly 15% seen in previous years. The following charts from Nick at Floating Path do a great job summarizing the trend. Click here to download Nick’s full report with high-resolution charts and great detailed information.
Here’s the whole index followed by a city breakdown showing the rate of growth.
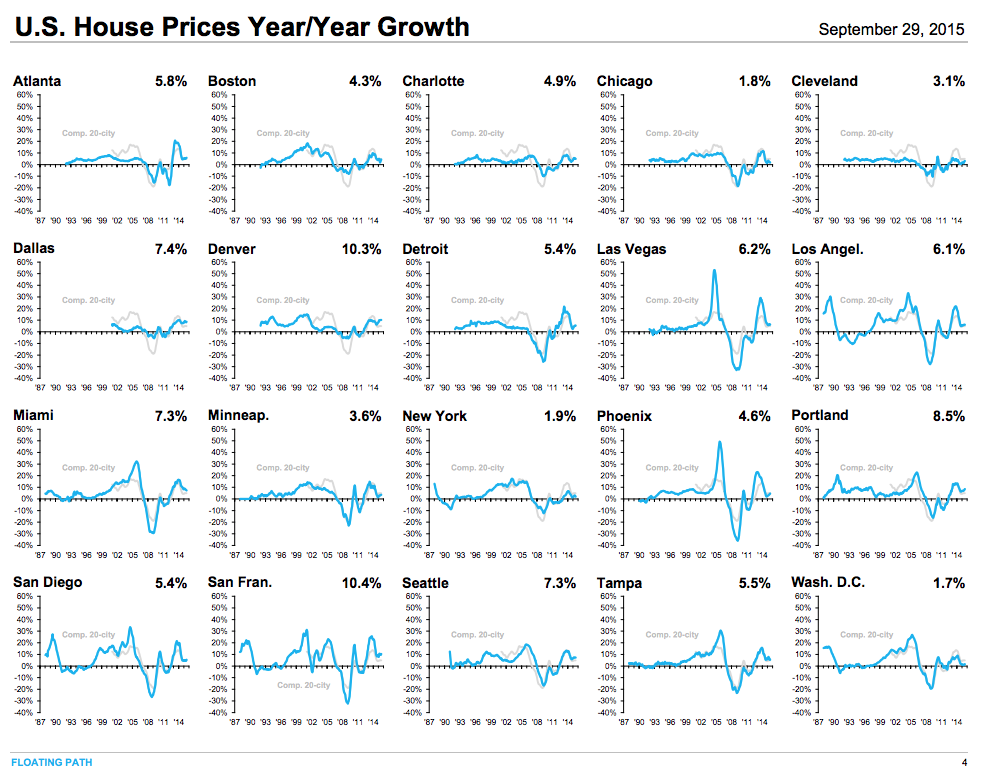
 and year-over-year growth by city:
 Source: