Re-sizing U.S. Counties Based on Local Economies
When you look across the globe, 54% of the world population is city dwellers and 80% of economic activity occurs in cities. Cities are engines of growth that leverage networks and economies of scale to create “economies of agglomeration”.
Max Galka has created a great visualization of the metro economic impact across the United States. In these cartograms, the size of each county is distorted to reflect its relative economic contribution to GDP. (It’s great to see our home-town favorite, the Charlotte Metro Region, holding it own between Greater Atlanta and Greater D.C. !)
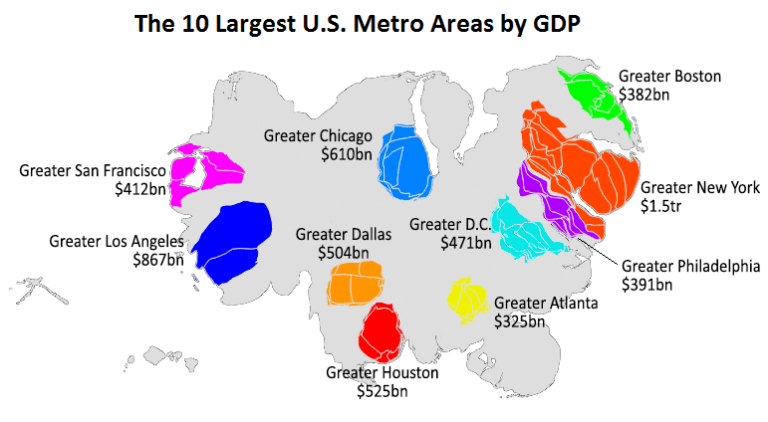
U.S. Map Re-sized Based on Local GDP Contributions
Here’s a static frame that shows the heft of the 10 largest U.S. metro regions by GDP. Greater New York City at $1.5 trillion GDP is as big as Boston, Philadelphia, Atlanta, and Washington, D.C. combined!
 Source: Visual Capitalist