Great Expectations
Expectations are very important. If you know what to expect, you shouldn’t be surprised. And if you’re not surprised, you won’t panic.
Coaching clients on what to expect and how (not) to respond to extraneous events is our defining role as a trusted advisor.
We invest in stocks because of their superior returns. Those historically higher returns are a reward for tolerating volatility (i.e., the “volatility premium”). But what does stock volatility look like in the real world? What pattern of price variability should we expect?
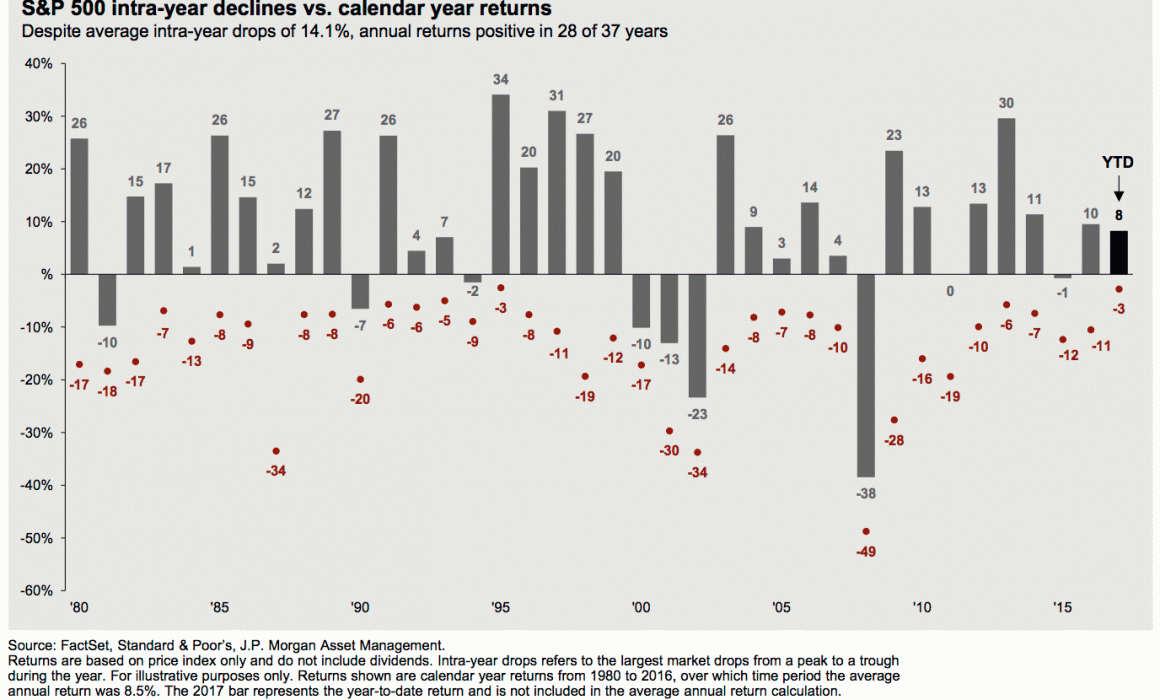
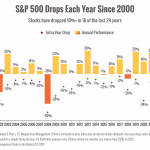
Well, here it is in its most elegant of graphical forms (click image for a bigger view).
Here’s how to read this chart:
- The intra-year decline versus the annual return of the S&P 500 are plotted vertically with years running horizontally from 1980 through year-to-date 2017.
- The annual return (grey bars) show the calendar year price increase. For example, in 1980 stocks climbed 26% for the year.
- The intra-year decline (red dots) is the largest market drop from peak to trough during that year. For example, in 1980 we experienced a 17% drawdown.
- Putting these together, in 1980 the stock market dipped 17% before closing up 26% by the end of the year.
It’s not hard to see that short, intra-year declines are the norm.
In fact, the average intra-year drop is 14.1%. But despite these temporary declines, the annual returns are positive in 28 of 37 years (76% of the time). During the charted time period 1980 to 2016 the average annual return was 8.5% This pattern is persistent. If you look back to 1946, the average drawdown is a remarkably close 13.8%, and the price return was positive 50 of the 71 years (70% of the time).
History shows the declines are temporary, the advance is permanent.
Think about how the average person responds to these intra-year declines. The financial media is screaming about the crisis du jour which is consistently characterized as the end of the world (“I’ve lived through some terrible things in my life, some of which have actually happened.” — Mark Twain ). Data shows the average investor, without the support of a caring, empathetic coach/advisor, consistently sells at the worst of times – i.e., during one of these perfectly normal and temporary pullbacks.
Volatility does not equal a financial loss unless you sell.
In our humble opinion, possessing an informed expectation, one that allows you to ignore short-term gyrations to capture long-term gains, is a Great Expectation.


