Stock Market’s Merry Performance Over Time
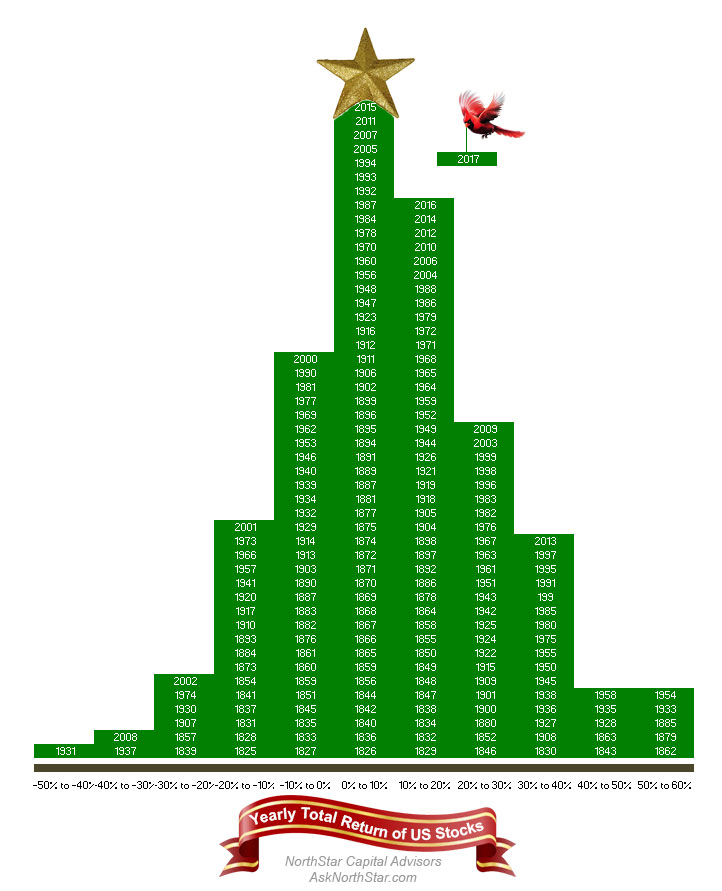
Stacking up the stock market’s annual performance going back nearly 200 years looks rather merry and bright. Our graphic above updates the seasonal interpretation of the stock market’s history first pointed out by Carter Worth.
Each block of the Christmas tree represents the annual total return of the U.S. stock market. The S&P 500 is used from the index’s inception in 1928 through the present. The Dow Jones Industrial Average is used 1896 through 1927. Finally, aggregate data published by Goetzmann, Ibbotson and Peng covers 1825 through 1895.
Since 1825, the stock market has produced an annual gain 71% of the time, or 137 times, while losing ground just 55 times. A standard distribution chart, which happens to take the shape of a Christmas tree, shows how for most years, the market moves within a range of zero to up 10%.
With only 15 trading days left in 2017, the S&P 500 is up nearly 20% year to date. So it looks like we’ll be adding a new branch to the right side of our tree!
Happy Holidays from our family to yours.