NorthStar Capital AdvisorsNorthStar Capital AdvisorsNorthStar Capital AdvisorsNorthStar Capital Advisors
Start Here
  • How We Help
  • Who We Serve
  • Who We Are
  • Fiduciary
  • Learning
  • Start Here
  • How We Help
  • Who We Serve
  • Who We Are
  • Fiduciary
  • Learning
  • Start Here

Happens All The Time

  • January 21, 2016/
  • Posted By : admin/
  • 0 comments /
  • Under : Behavior, Market Outlook, Performance, Retirement

normal

The New Year selloff in stocks has captured a lot of attention because,

  1. We’re not used to this since the market has been unusually quiescent the past few years
  2. The decline is global
  3. The speed of descent is significant

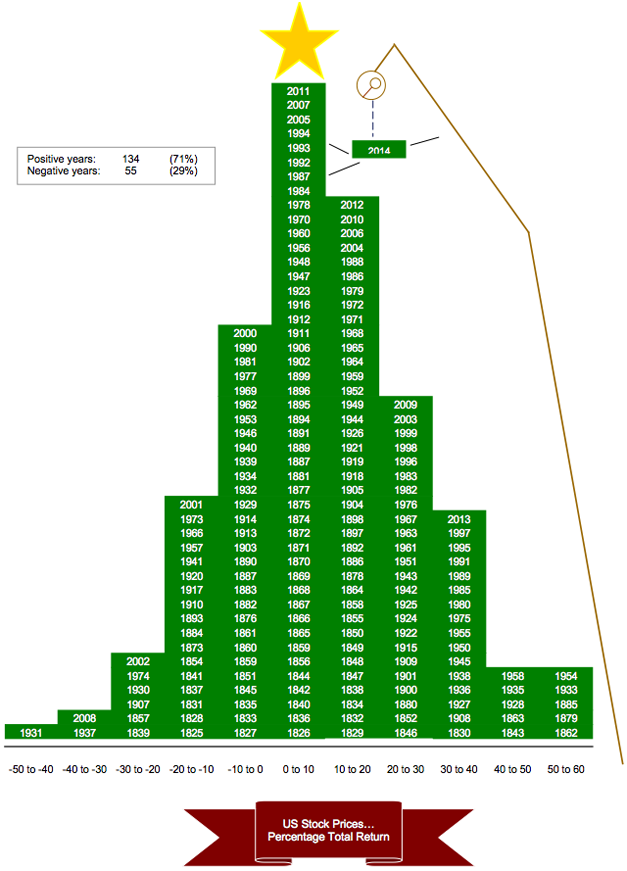
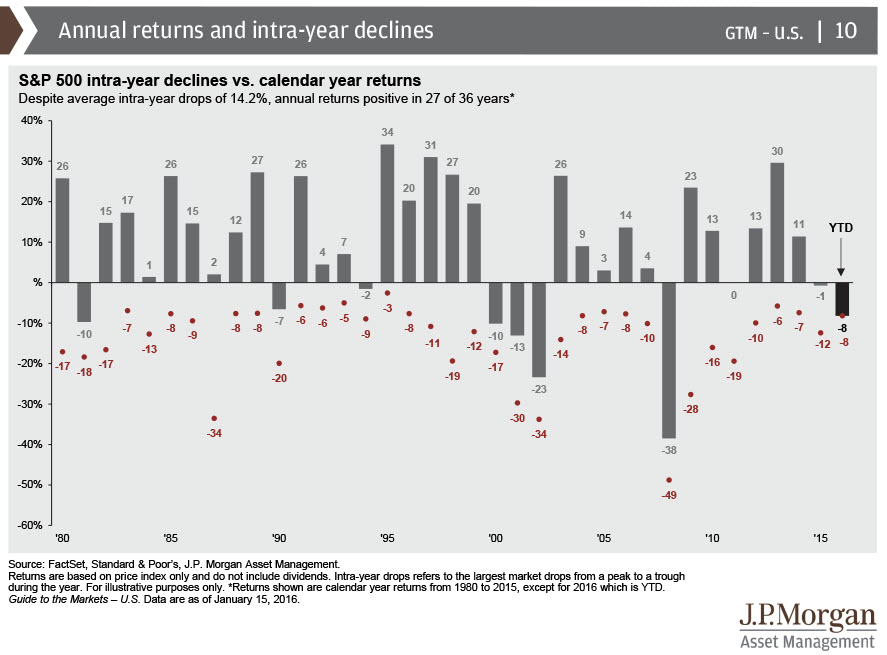
But despite perception, double-digit declines from prior highs are the norm, not an anomaly.  It happens two out of every three years.

Here are great points of reference to put this market event into context:

  • The average intra-year decline is 16.4%. This current decline might feels worse due to the speed at which it’s happening, and because it’s occurring right out of the gate.
  • Double digit declines are to be expected, 64% of all years experienced them.
  • It’s not unusual for those double digit declines to be of little importance. 57% of the years with 10% drawdowns finished positive.
  • Stated differently, 36% of all years saw a double digit decline and still finished positive.
  • Drawdowns of 20% or more have happened 23 times, or 26% of all years. On five of those 23 occasions, stocks still ended up positive on the year.

The following chart provides a great visual on how intra-year drawdowns are normal.

intra-year-declines

Source: TII


Asset Class Performance, 1H 2015

  • July 9, 2015/
  • Posted By : admin/
  • 0 comments /
  • Under : Best Practices, Investing 101, Performance

From the Novel Investor:
The chart below shows several issues investors struggle with all the time. It’s difficult to pick the best performing investment year after year, yet for many investors it’s an annual event. They look for an encore, picking the best asset class last year with the hope of a repeat performance. Yet, betting on last year’s winner rarely works out.

Assets at the top of the chart one year could be at the bottom the next, and vice versa. Much of this is due to reversion to the mean. But over the long-term, those big swings even out. The chart shows annual returns for eight asset classes against a diversified portfolio. Diversification works to smooth out those big swings in the short-term. While you’ll never get the biggest gains of any year, you avoid the huge losses.

Asset-class-20151H

The chart above ranks the best to worst investment returns by asset class over the past 15 years.

Source: Novel Investor


Best Illustration of Bull & Bear Markets

  • January 22, 2015/
  • Posted By : admin/
  • 0 comments /
  • Under : Market Outlook, Performance

bull-bear-chartThis is the best illustration we’ve ever seen of history’s bull and bear markets.  Blue illustrates past bull markets’ durations and returns (total and annualized).  Red illustrates the bear markets.  This was published in May 2014 so the current bull market is actually pushing 69 months.

Some key takeaways:

  1. There’s a lot more blue than red meaning stocks tend to spend more time going up in value than going down.
  2. The current bull market might feel long but by historical standards, the length and strength of this bull is not exceptional

Source: BI


Stock Market’s Merry Performance Over Time

  • December 25, 2014/
  • Posted By : admin/
  • 0 comments /
  • Under : Performance

stocks-christmas-tree

Above is Carter Braxton Worth’s seasonal interpretation of the stock market’s history.  Stacking up the stock market’s annual performance going back nearly 200 years can look merry and bright.

Since 1825, the stock market has produced an annual gain 71% of the time, or 134 times, while losing ground just 55 times. A standard distribution chart, which happens to take the shape of a Christmas tree, shows how for most years, the market moves within a range of zero to up 10%.

Source: MarketWatch


Colleges That Produce The Best Investors (?)

  • October 9, 2014/
  • Posted By : admin/
  • 0 comments /
  • Under : Performance

uvaA new study on which schools produce the best investors has U.Va. in the top spot, according to the Wall Street Journal.

SumZero – “a gated online community” for investment pros analyzed their user data reaching back to 2008.  The University of Virginia produces better stock pickers on average than any of the Ivy Colleges.

ranking2

And just in case you’re wondering, two-third of the personnel at NorthStar Capital Advisors are U.Va. graduates!

By the way — we consider these results as pure entertainment.  Stock picking is only part of the big picture.  Long-term success for most investors requires careful planning, diligent saving, and disciplined execution of your investing strategy.


Chasing Past Performance is Expensive

  • September 18, 2014/
  • Posted By : admin/
  • 0 comments /
  • Under : Behavior, Best Practices, Mutual Funds, Performance, Seeking Prudent Advice

vanguard-chasingA new study demonstrates that chasing the hot mutual fund is an inferior investing strategy compared to good, old-fashioned buy and hold.

Vanguard analyzed a decade of data ending December 31, 2013 across nine asset classes.  In every case the investor would have been significantly better off just sticking with the index.  On average the indexes generated 50% higher returns than the performance-chasing strategy!

Buy and hold may not be perfect, but it can be a lot better than flitting from mutual fund to mutual fund.


75% of Americans get the Most Important Investing Question WRONG

  • August 21, 2014/
  • Posted By : admin/
  • 0 comments /
  • Under : Bonds, Mutual Funds, Performance, Personal Finance, Seeking Prudent Advice

Powerful observation from Vox.com regarding public perception versus reality when it comes to how to best invest your money:

Which of the following do you think is the best long-term investment?

  1. Real Estate

  2. Gold

  3. Stocks/Mutual Funds

  4. Savings Account

Don’t feel bad if you didn’t get the answer right. You’re in good company.

Recently, Gallup asked Americans what they thought their best investment bet was over the long run. 24 percent of Americans named stocks and mutual funds — but the same share named gold, and even more (30 percent) named real estate. The trend lines are actually positive, as in 2011 a baffling 34 percent of Americans named gold as their top pick:

gallupThere’s a right answer here — and it’s one that about two thirds of respondents who answered the question got wrong. If history is any guide, stocks are the best bet in the long run, and gold and real estate certainly are not.

siegel_returns

Source: Vox.com


Annual Asset Class Returns

  • August 7, 2014/
  • Posted By : admin/
  • 0 comments /
  • Under : Performance, Seeking Prudent Advice

The table below ranks the best to worst investment returns by asset class over the past 15 years.  CLICK IT FOR A CLOSER LOOK
asset-returnsGreat chart from Novelinvestor:

The chart  shows several issues investors struggle with all the time. It’s difficult to pick the best performing investment year after year, yet for many investors it’s an annual event. They look for an encore, picking the best asset class last year with the hope of a repeat performance. Yet, betting on last year’s winner rarely works out.

Assets at the top of the chart one year could be at the bottom the next, and vice versa. Much of this is due to reversion to the mean. But over the long-term, those big swings even out.  The chart shows annual returns for eight asset classes against a diversified portfolio. Diversification works to smooth out those big swings in the short-term. While you’ll never get the biggest gains of any year, you avoid the huge losses.


Know More, Make More

  • May 22, 2014/
  • Posted By : admin/
  • 0 comments /
  • Under : Best Practices, Performance, Personal Finance, Retirement, Seeking Prudent Advice

knowledge-powerA new academic study finds that more financially knowledgeable people earn a higher return on their 401(k) retirement savings.

Dr Robert Clark (NC State University), Dr. Annamaria Lusardi (George Washington University), and Dr.  Olivia Mitchell (University of Pennsylvania) analyzed a unique dataset that combined 401(k) performance data for 20,000 employees plus financial literacy data for the same workers.

Investors deemed to be more financially knowledgeable than peers enjoyed an estimated 1.3% higher annual return in their 401(k)s or other defined contribution plans than those with less knowledge.

According to the study’s authors:
“We show that more financially knowledgeable employees are also significantly more likely to hold stocks in their 401(k) plan portfolios. They can also anticipate significantly higher expected excess returns, which over a 30-year working career could build a retirement fund 25% larger than that of their less-knowledgeable peers.”

Financially savvy people tend to save more and are more likely to invest those savings in the stock market. But past studies haven’t clearly demonstrated that these people necessarily make better investment decisions. The authors look at patterns in 401(k) retirement accounts and find that more sophisticated investors do indeed get better returns on their savings.

Source: “Financial Knowledge and 401(k) Investment Performance”


Elite Colleges Don’t Buy Happiness or Extra Money for Graduates

  • May 8, 2014/
  • Posted By : admin/
  • 0 comments /
  • Under : Performance, Personal Finance, Saving Money, Seeking Prudent Advice

graduates

Attention high school seniors that were rejected by their first-choice college

A new Gallup survey of 30,000 college graduates of all ages in all 50 states has found that graduation from an elite college provides no discernible advantage over Podunk U.

“It matters very little where you go; it’s how you do it” that counts, said Brandon Busteed, executive director of Gallup Education.

Gallup’s data demonstrate that people that feel the happiest and most engaged are the most productive.  Those successful people got to that point by developing meaningful connections with professors or mentors, and made significant investments in long-term academic projects and extracurricular activities.

This new study’s results are well aligned with the existing body of academic research.  For example, economist Stacy Dale published  an insightful paper in 2004 that found that students who were accepted to elite schools, but attended less selective schools, went on to earn just as much money as their elite counterparts.

“Individual traits matter more than where you went,” Ms. Dale said. “It’s a lot more important what you learn later in life than where you got your undergraduate degree.”

Source: WSJ


1234
Recent Posts
  • What the Fed sees…and why it matters September 2,2025
  • New Tax Law: 7 Big Changes You Should Know About August 1,2025
  • Markets at All-Time Highs: What Should You Do Now? July 1,2025
  • Thoughts on the shifting housing market June 5,2025
  • The patience premium: What market history teaches us May 1,2025
Archives
  • September 2025
  • August 2025
  • July 2025
  • June 2025
  • May 2025
  • April 2025
  • March 2025
  • February 2025
  • January 2025
  • December 2024
  • November 2024
  • October 2024
  • September 2024
  • August 2024
  • July 2024
  • June 2024
  • May 2024
  • April 2024
  • March 2024
  • February 2024
  • January 2024
  • December 2023
  • November 2023
  • October 2023
  • September 2023
  • August 2023
  • June 2023
  • May 2023
  • April 2023
  • March 2023
  • February 2023
  • January 2023
  • November 2022
  • October 2022
  • September 2022
  • August 2022
  • July 2022
  • May 2022
  • April 2022
  • March 2022
  • February 2022
  • December 2021
  • October 2021
  • September 2021
  • August 2021
  • July 2021
  • June 2021
  • May 2021
  • April 2021
  • March 2021
  • February 2021
  • January 2021
  • December 2020
  • November 2020
  • October 2020
  • September 2020
  • August 2020
  • July 2020
  • June 2020
  • May 2020
  • April 2020
  • March 2020
  • November 2019
  • October 2019
  • June 2019
  • May 2019
  • April 2019
  • March 2019
  • February 2019
  • January 2019
  • December 2018
  • November 2018
  • October 2018
  • September 2018
  • August 2018
  • July 2018
  • June 2018
  • May 2018
  • April 2018
  • March 2018
  • February 2018
  • January 2018
  • December 2017
  • November 2017
  • October 2017
  • September 2017
  • August 2017
  • July 2017
  • June 2017
  • May 2017
  • April 2017
  • March 2017
  • February 2017
  • January 2017
  • December 2016
  • November 2016
  • October 2016
  • September 2016
  • August 2016
  • July 2016
  • June 2016
  • May 2016
  • April 2016
  • March 2016
  • February 2016
  • January 2016
  • December 2015
  • November 2015
  • October 2015
  • September 2015
  • August 2015
  • July 2015
  • June 2015
  • May 2015
  • April 2015
  • March 2015
  • February 2015
  • January 2015
  • December 2014
  • November 2014
  • October 2014
  • September 2014
  • August 2014
  • July 2014
  • June 2014
  • May 2014
  • April 2014
  • March 2014
  • February 2014
  • January 2014
  • December 2013
  • November 2013
  • October 2013
  • September 2013
  • August 2013
  • July 2013
  • June 2013
  • May 2013
  • April 2013
  • March 2013
  • February 2013
  • January 2013
  • December 2012
  • November 2012
  • October 2012
  • September 2012
  • August 2012
  • July 2012
  • June 2012
  • May 2012
  • April 2012
  • March 2012
  • February 2012
  • January 2012
  • December 2011
  • November 2011
  • October 2011
  • September 2011
  • August 2011
  • July 2011
  • June 2011
  • May 2011
  • April 2011
  • March 2011
  • February 2011
  • January 2011
  • November 2010
  • October 2010
  • September 2010
  • August 2010
Categories
  • 401(k)
  • Annuities
  • Behavior
  • Best Practices
  • Bonds
  • Charitable Donations
  • Economy
  • Fees
  • Fiduciary
  • Financial Planning
  • Investing 101
  • Live Well
  • Market Outlook
  • Mutual Funds
  • NorthStar
  • Performance
  • Personal Finance
  • Planning
  • Retirement
  • Saving Money
  • Scams & Schemes
  • Seeking Prudent Advice
  • Tax Planning
  • Uncategorised
  • Uncategorized
  • Weekly Market Review
ABOUT US

We are a fee-only, independent fiduciary advisor. Our allegiance rests solely with our clients and their best interests. We are headquartered in Charlotte, North Carolina and serve client families across the nation.


CLIENT TOOLS
CONTACT
  • (704) 350-5028
  • info@nstarcapital.com
  • 521 East Blvd, Charlotte, NC 28203
    (by appointment only)
  • fax: (704) 626-3462
FROM OUR BLOG
  • What the Fed sees…and why it matters September 2,2025
  • New Tax Law: 7 Big Changes You Should Know About August 1,2025
  • Markets at All-Time Highs: What Should You Do Now? July 1,2025
Nothing on this website constitutes either the provision of investment advice or solicitation to provide investment advice.
Investment advice can only be provided through a formal investment advisory relationship.