NorthStar Capital AdvisorsNorthStar Capital AdvisorsNorthStar Capital AdvisorsNorthStar Capital Advisors
Start Here
  • How We Help
  • Who We Serve
  • Who We Are
  • Fiduciary
  • Learning
  • Start Here
  • How We Help
  • Who We Serve
  • Who We Are
  • Fiduciary
  • Learning
  • Start Here

Oh Baby! You’re Expensive

  • June 14, 2012/
  • Posted By : admin/
  • 0 comments /
  • Under : Economy

Many parents worry about saving for college, but don’t forget about the proceeding 17 years! Food, clothing, shelter, and other necessities will cost $234,900 for a child born in 2011 to a middle-income family.

Today the the U.S. Department of Agriculture released their annual report where they total up the cost that parents pay to raise a child from birth to age 17.

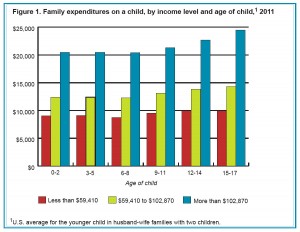
  • The annual expense per child ranges from $8,760 to $9,970 on average (depending on age) for households with an annual income less than $59,410.
  • The annual cost increases to $12,290 to $14,320 for households with income up to $102,870.
  • The annual cost increases yet again to $20,420 to $24,510 for households with annual income greater than $102,870.

Housing, childcare & education, and food comprise 64% of the expenses.

Family expenditures on a child, by income level and age of child (CLICK TO ENLARGE)

It’s interesting to compare the costs of raising a child born in 1960 (the year the USDA study first started) to a child of 2011.  The total cost has increased 22% from $191,723 in 1960 (in 2011 dollars) to $234,900 in 2011.

  • Food has decreased from 24% of the cost in 1960 to 16% in 2011
  • Clothing has shrunk from 11% in 1960 to 6% in 2011
  • Childcare & education has surged from only 2% in 1960 to 18% in 2011
  • Healthcare has doubled from 4% in 1960 to 8% in 2011
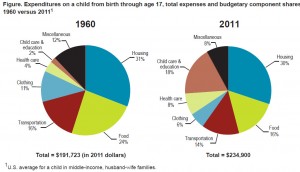
Expenditures on a child from birth through age 17, total expenses and budgetary component shares, 1960 versus 2011 (CLICK TO ENLARGE)


Comparing Medical Procedure Costs in US vs Overseas

  • March 22, 2012/
  • Posted By : admin/
  • 0 comments /
  • Under : Economy

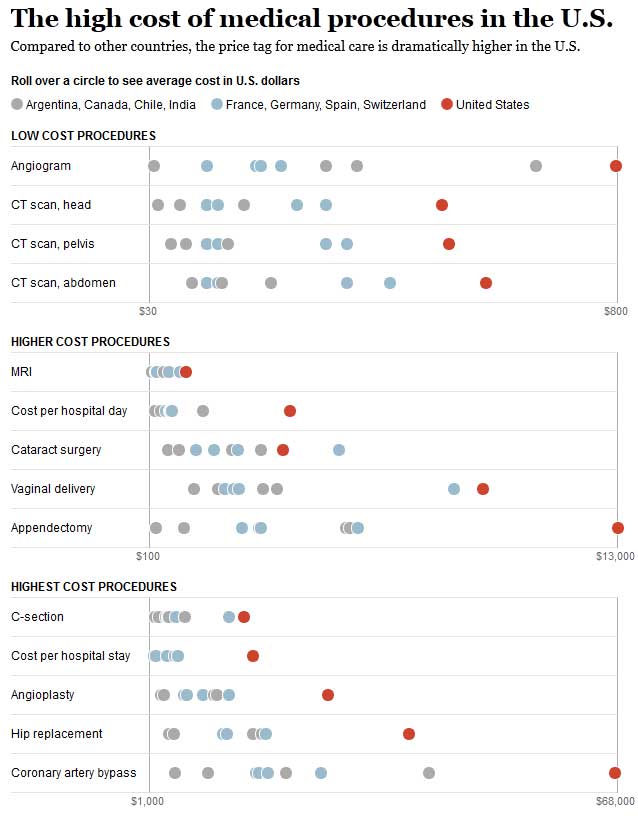
Very informative graphic from the Washington Post as to why a coronary bypass costs $68,000 in the US versus $25,000 in Switzerland:

Click for larger interactive graphic


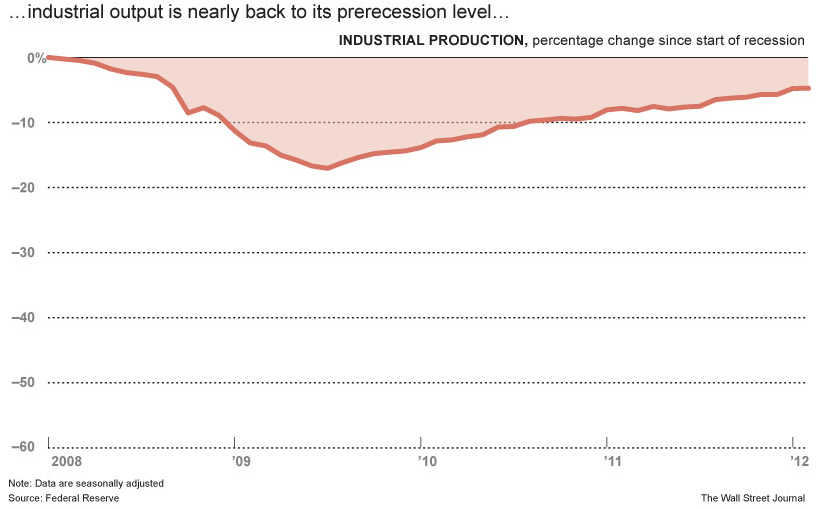
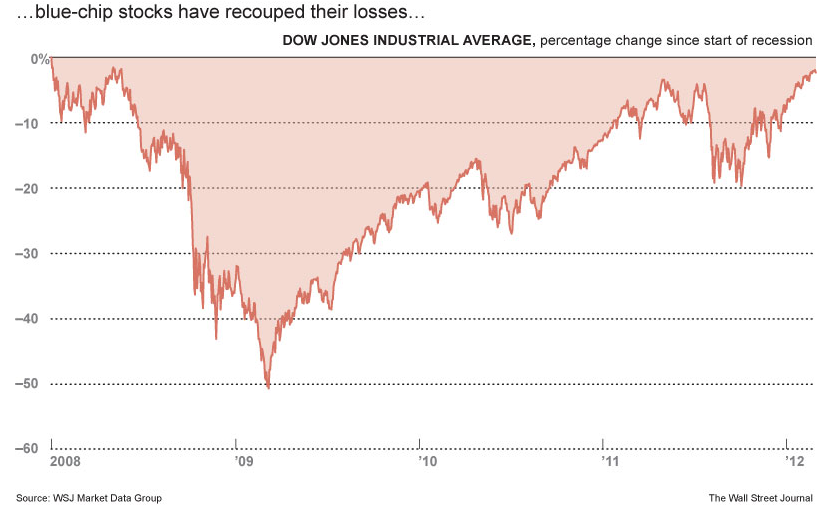
U.S. Economic Recovery Shows Signs of Accelerating

  • March 8, 2012/
  • Posted By : admin/
  • 0 comments /
  • Under : Economy


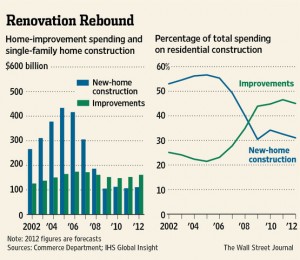
Renovation Rebound ~ Remodeling instead of moving

  • January 19, 2012/
  • Posted By : admin/
  • 0 comments /
  • Under : Economy

click for larger chart

“People are remodeling instead of moving” according to David Crowe, chief economist of the National Association of Home Builders.

The key to this are the huge number of current homeowners who either are unable to sell their currents homes, or if they do, no longer will qualify for a new mortgage, or lack a 15-25% down payment for another purchase in order to move.

During Q3 2011, homeowners took out $5.3 billion in home equity/refinancing. That has been driving some of these renovations.

Regardless, housing will remain a dark spot in the economy for an extended time.


Where Are People Searching For Homes?

  • January 5, 2012/
  • Posted By : admin/
  • 0 comments /
  • Under : Economy

From Trulia’s database of home searches, based on their web traffic from 2006 through 2011:

click for timelapse


The New Gilded Age

  • October 26, 2011/
  • Posted By : admin/
  • 0 comments /
  • Under : Economy

The top 1 percent of American earners controls as much of the nation’s total income as it did on the eve of the Great Depression. Now, however, their money comes from skyrocketing paychecks more than from unearned income, as it did in 1928.

click image for larger view


Source: The New York Times


Fewer jobs, less pay

  • October 20, 2011/
  • Posted By : admin/
  • 0 comments /
  • Under : Economy

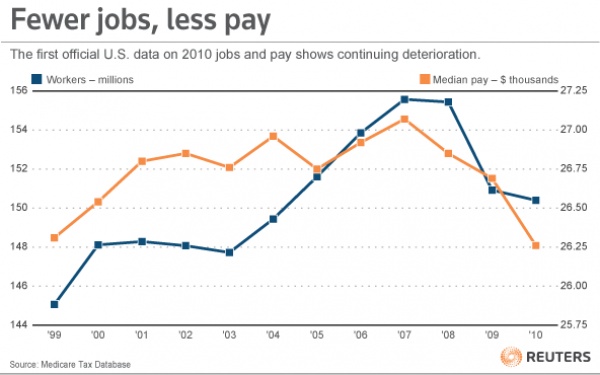
The latest data on employment and wages are out and it’s not good:

The figures from payroll taxes reported to the Social Security Administration on jobs and pay are, in a word, awful.

There were fewer jobs and they paid less last year, except at the very top where, the number of people making more than $1 million increased by 20 percent over 2009.  The median paycheck — half made more, half less — fell again in 2010, down 1.2 percent to $26,364. That works out to $507 a week, the lowest level, after adjusting for inflation, since 1999.

The number of Americans with any work fell again last year, down by more than a half million from 2009 to less than 150.4 million.

Source:
First look at US pay data, it’s awful
David Cay Johnston
Reuters, 10/19/2011


1234567
Recent Posts
  • What the Fed sees…and why it matters September 2,2025
  • New Tax Law: 7 Big Changes You Should Know About August 1,2025
  • Markets at All-Time Highs: What Should You Do Now? July 1,2025
  • Thoughts on the shifting housing market June 5,2025
  • The patience premium: What market history teaches us May 1,2025
Archives
  • September 2025
  • August 2025
  • July 2025
  • June 2025
  • May 2025
  • April 2025
  • March 2025
  • February 2025
  • January 2025
  • December 2024
  • November 2024
  • October 2024
  • September 2024
  • August 2024
  • July 2024
  • June 2024
  • May 2024
  • April 2024
  • March 2024
  • February 2024
  • January 2024
  • December 2023
  • November 2023
  • October 2023
  • September 2023
  • August 2023
  • June 2023
  • May 2023
  • April 2023
  • March 2023
  • February 2023
  • January 2023
  • November 2022
  • October 2022
  • September 2022
  • August 2022
  • July 2022
  • May 2022
  • April 2022
  • March 2022
  • February 2022
  • December 2021
  • October 2021
  • September 2021
  • August 2021
  • July 2021
  • June 2021
  • May 2021
  • April 2021
  • March 2021
  • February 2021
  • January 2021
  • December 2020
  • November 2020
  • October 2020
  • September 2020
  • August 2020
  • July 2020
  • June 2020
  • May 2020
  • April 2020
  • March 2020
  • November 2019
  • October 2019
  • June 2019
  • May 2019
  • April 2019
  • March 2019
  • February 2019
  • January 2019
  • December 2018
  • November 2018
  • October 2018
  • September 2018
  • August 2018
  • July 2018
  • June 2018
  • May 2018
  • April 2018
  • March 2018
  • February 2018
  • January 2018
  • December 2017
  • November 2017
  • October 2017
  • September 2017
  • August 2017
  • July 2017
  • June 2017
  • May 2017
  • April 2017
  • March 2017
  • February 2017
  • January 2017
  • December 2016
  • November 2016
  • October 2016
  • September 2016
  • August 2016
  • July 2016
  • June 2016
  • May 2016
  • April 2016
  • March 2016
  • February 2016
  • January 2016
  • December 2015
  • November 2015
  • October 2015
  • September 2015
  • August 2015
  • July 2015
  • June 2015
  • May 2015
  • April 2015
  • March 2015
  • February 2015
  • January 2015
  • December 2014
  • November 2014
  • October 2014
  • September 2014
  • August 2014
  • July 2014
  • June 2014
  • May 2014
  • April 2014
  • March 2014
  • February 2014
  • January 2014
  • December 2013
  • November 2013
  • October 2013
  • September 2013
  • August 2013
  • July 2013
  • June 2013
  • May 2013
  • April 2013
  • March 2013
  • February 2013
  • January 2013
  • December 2012
  • November 2012
  • October 2012
  • September 2012
  • August 2012
  • July 2012
  • June 2012
  • May 2012
  • April 2012
  • March 2012
  • February 2012
  • January 2012
  • December 2011
  • November 2011
  • October 2011
  • September 2011
  • August 2011
  • July 2011
  • June 2011
  • May 2011
  • April 2011
  • March 2011
  • February 2011
  • January 2011
  • November 2010
  • October 2010
  • September 2010
  • August 2010
Categories
  • 401(k)
  • Annuities
  • Behavior
  • Best Practices
  • Bonds
  • Charitable Donations
  • Economy
  • Fees
  • Fiduciary
  • Financial Planning
  • Investing 101
  • Live Well
  • Market Outlook
  • Mutual Funds
  • NorthStar
  • Performance
  • Personal Finance
  • Planning
  • Retirement
  • Saving Money
  • Scams & Schemes
  • Seeking Prudent Advice
  • Tax Planning
  • Uncategorised
  • Uncategorized
  • Weekly Market Review
ABOUT US

We are a fee-only, independent fiduciary advisor. Our allegiance rests solely with our clients and their best interests. We are headquartered in Charlotte, North Carolina and serve client families across the nation.


CLIENT TOOLS
CONTACT
  • (704) 350-5028
  • info@nstarcapital.com
  • 521 East Blvd, Charlotte, NC 28203
    (by appointment only)
  • fax: (704) 626-3462
FROM OUR BLOG
  • What the Fed sees…and why it matters September 2,2025
  • New Tax Law: 7 Big Changes You Should Know About August 1,2025
  • Markets at All-Time Highs: What Should You Do Now? July 1,2025
Nothing on this website constitutes either the provision of investment advice or solicitation to provide investment advice.
Investment advice can only be provided through a formal investment advisory relationship.