NorthStar Capital AdvisorsNorthStar Capital AdvisorsNorthStar Capital AdvisorsNorthStar Capital Advisors
Start Here
  • How We Help
  • Who We Serve
  • Who We Are
  • Fiduciary
  • Learning
  • Start Here
  • How We Help
  • Who We Serve
  • Who We Are
  • Fiduciary
  • Learning
  • Start Here

Best Illustration of Bull & Bear Markets

  • November 30, 2017/
  • Posted By : admin/
  • 0 comments /
  • Under : Market Outlook, Performance

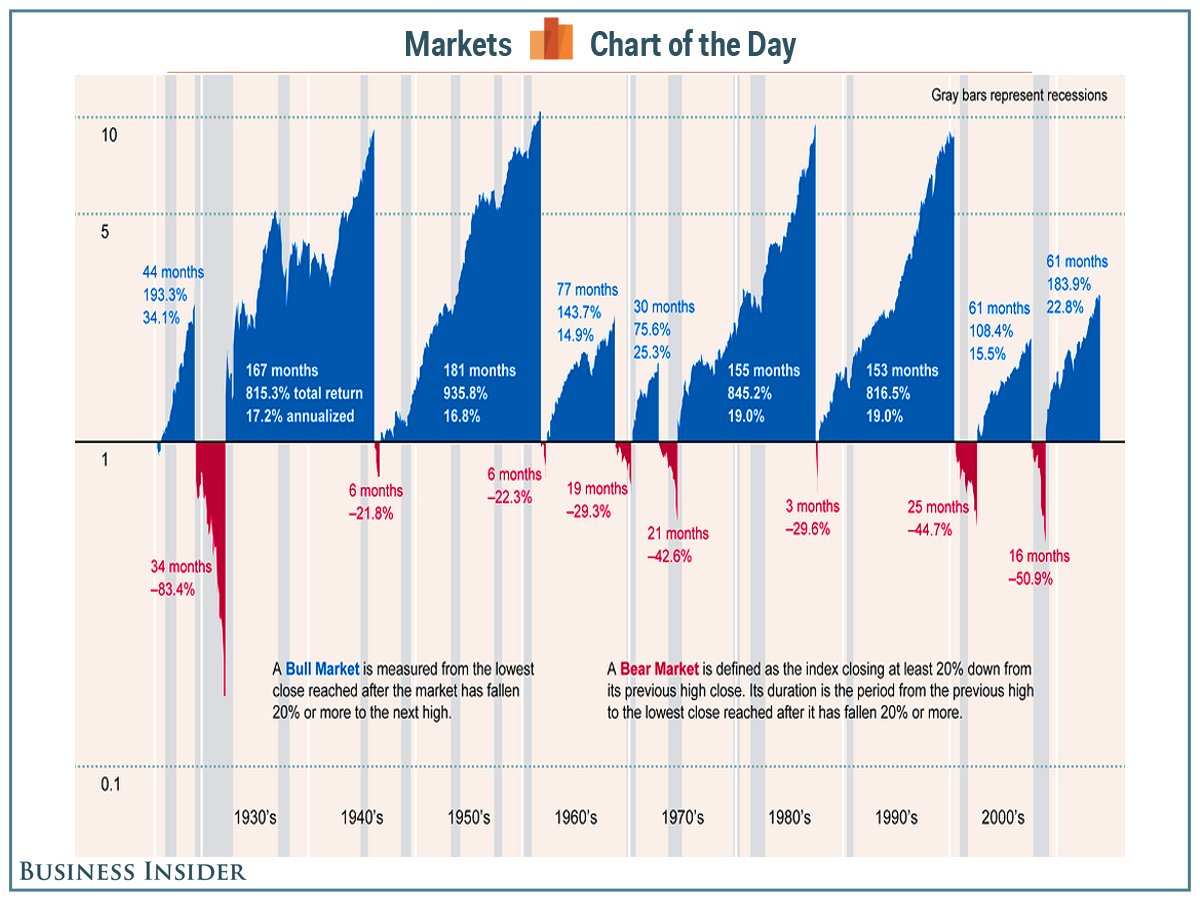
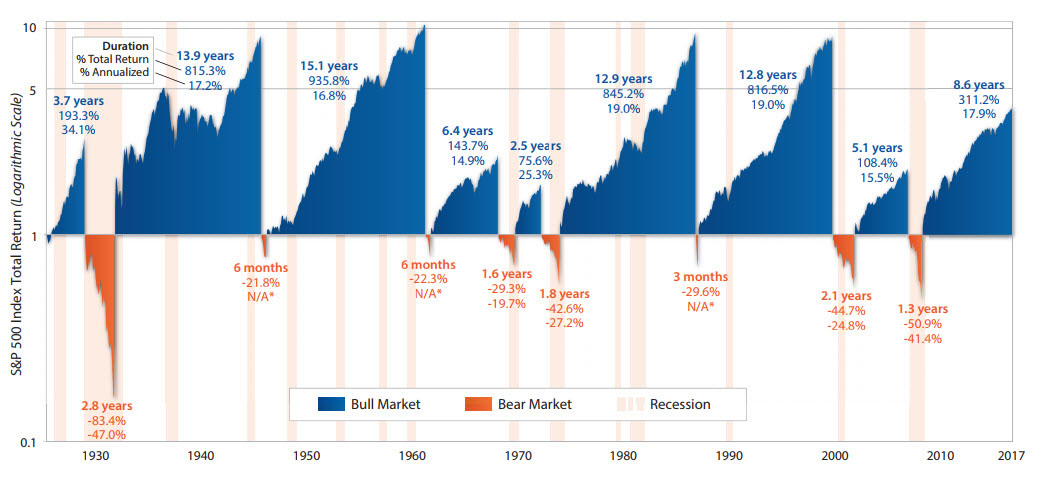
Here’s the best illustration we’ve ever seen of history’s bull and bear markets.  This chart shows the performance of the S&P 500 Index from 1926 through September 2017. Blue denotes past bull markets’ durations and returns (total and annualized).  Orange denotes the bear markets.  The pink vertical bars delineate recessions.

At a 100,000-ft level, this chart underscores the benefits of investing for the long-term. Two specific takeaways:

  1. There’s a lot more blue than orange meaning stocks tend to spend more time going up in value than going down.
  2. The current bull market might feel long, but by historical standards, the length and strength of this bull is not exceptional

Source: First Trust


53 Smart-Sounding Reasons to Sell Stocks During 100x Market

  • December 8, 2016/
  • Posted By : admin/
  • 0 comments /
  • Under : Behavior, Best Practices, Market Outlook

Here are 53 smart-sounding reasons to sell stocks during a period in which the market went up 100x after inflation.

53-smart-reasonsThese days it seems all too easy to come up with a reason to be pessimistic. Be careful.

Optimism is the only realism. It’s the only worldview which squares with the facts, and with the historical record.

Source: Morgan Housel


Tune Out the Noise…your portfolio will thank you for it!

  • December 1, 2016/
  • Posted By : admin/
  • 0 comments /
  • Under : Behavior, Best Practices, Market Outlook, Seeking Prudent Advice

noise

One Day in Mainstream Media Market Headlines…

6:00 AM MarketWatch US Futures Down As Euro Pressures Mount

6:30 AM TheStreet.com US Stock Futures Recover on Amazon Tablet Expectation

7:15 AM MarketWatch Stocks Fall in Pre-Market Amid Global Concerns

8:00 AM Minyanville Stocks Buoyant Ahead of August Durable Goods Orders

8:10 Wall Street Journal US Marts Down Briefly, Techs Remain Higher

9:15 AM TheStreet.com US Stocks Mixed Ahead of Open After Durable Goods Orders

9:45 AM MarketWatch Stocks Decline Slightly On Economic Concerns

10:15 AM MarketWatch US Stocks Fall on European Woes

11:00 AM Minyanville Stocks Up After Morning in Which They Were Slightly Down

11:30 AM TheStreet.com Stocks Exist  at Half Past 11 AM this Morning

12:00 PM  MarketWatch Stocks Slightly Higher at Mid-Day as I Pick Up My Dry Cleaning

12:15 PM Bloomberg Markets Stabilize as Japanese PM Explains Proclivity for Vending Machine Pornography

12:30 PM Minyanville US Markets Rally Modestly as Stocks Don’t Be Down

1:00 PM TheStreet.com Stocks Off Slightly After Cloud Passes Briefly in Front of the Sun

1:30 PM Reuters We are Better than You and You Probably Realise that by Now

1:50 PM Wall Street Journal US Stocks Extend Advance after Not Extending Decline

2:15 PM Minyanville Markets in Retreat as Euro Pressures Threaten Global Recovery

3:10 PM TheStreet.com US Stocks Unchanged, We Are Seriously Running Out of Reasons for Random Things You Guys

3:11 PM TheStreet.com US Stocks Still Unchanged, We Just Checked For You

3:34 PM Bloomberg Markets Neutral Into the Close

3:37 PM MarketWatch Neutral Markets Into the Close

3:50 PM Wall Street Journal Stocks Set to Close Flat on Session as European Woes Continue to Cause Concern

3:56 PM Reuters US Stock Market Flat on Close

4:01 PM MarketWatch No Change in US Stocks Today on Excessive Nonsensical Headlines, Tune in Tomorrow

Avoid getting caught up in the hype and drama of media’s talking heads.


Your Investments Don’t Care Who Wins

  • October 27, 2016/
  • Posted By : admin/
  • 0 comments /
  • Under : Behavior, Best Practices, Bonds, Live Well, Market Outlook, Seeking Prudent Advice

Countless words and boundless time have been expended over the ages debating which political party is best for the investment markets. Good news! You can stop worrying and wasting your time because 160 years of history are very clear on this question.

markets-dont-careVanguard research going back to 1853 demonstrates that stock market returns are virtually identical regardless of which party is in the White House (see chart above).  Similarly, Vanguard finds the political party of the president has little impact on the bond market as well.

So take a deep breath and relax because your investments* don’t care who wins on November 8th.
(* “your investments” should be a diverse portfolio of assets that serves a long-term investment discipline that is goal focused and planning driven) 

Source: Vanguard


Happens All The Time

  • January 21, 2016/
  • Posted By : admin/
  • 0 comments /
  • Under : Behavior, Market Outlook, Performance, Retirement

normal

The New Year selloff in stocks has captured a lot of attention because,

  1. We’re not used to this since the market has been unusually quiescent the past few years
  2. The decline is global
  3. The speed of descent is significant

But despite perception, double-digit declines from prior highs are the norm, not an anomaly.  It happens two out of every three years.

Here are great points of reference to put this market event into context:

  • The average intra-year decline is 16.4%. This current decline might feels worse due to the speed at which it’s happening, and because it’s occurring right out of the gate.
  • Double digit declines are to be expected, 64% of all years experienced them.
  • It’s not unusual for those double digit declines to be of little importance. 57% of the years with 10% drawdowns finished positive.
  • Stated differently, 36% of all years saw a double digit decline and still finished positive.
  • Drawdowns of 20% or more have happened 23 times, or 26% of all years. On five of those 23 occasions, stocks still ended up positive on the year.

The following chart provides a great visual on how intra-year drawdowns are normal.

intra-year-declines

Source: TII


Top Investing Ideas for 2016 (or any other year)

  • December 31, 2015/
  • Posted By : admin/
  • 0 comments /
  • Under : Behavior, Best Practices, Economy, Investing 101, Market Outlook

2016 Calender on the red cubes

It that time of year where the financial media machine is awash with seemingly important predictions for the new year.  Despite all the hype, no one can reliably forecast market moving events or trends.   Resisting the urge to build investment strategies around faulty forecasts, Bob Seawright provides a quick summary of his top investment ideas for 2016 (or any other year), none of which is dependent upon predicting the future:

  1. Einstein wisely advised that we keep things as simple as possible, but no simpler. Overly complicated systems, from financial derivatives to tax systems, are difficult to comprehend, easy to exploit and possibly dangerous. Simple rules, in contrast, can make us smart and create a safer world.
  2. Out of our general fear, we all too frequently bail on our investments and our plans and fail to invest altogether. But if we’re going to succeed, we need to invest, continue to invest and stay the course. Multiple studies have shown that those who trade the most earn the lowest returns. Remember Pascal’s wisdom: “All man’s miseries derive from not being able to sit in a quiet room alone.”
  3. The Uniform Prudent Investor Act stated: “Because broad diversification is fundamental to the concept of risk management, it is incorporated into the definition of prudent investing.” Fortunately, a well-diversified portfolio captures most of the potential upside available with much lower volatility. On the other hand, a well-diversified portfolio will always include some poor performers, and that’s hard for us to abide. Do it anyway.
  4. The idea that an investor ought to be aware and nimble enough to avoid market downturns or simply to find and move into better investments is remarkably appealing. But nobody does it successfully over time. We’ve all seen and done this: we find a hot new approach or hot new manager and, because what we own hasn’t been doing so well, we switch, only to find that the hotness that caused us to buy has cooled. We need to get off that merry-go-round.
  5. The leading factor in the success or failure of any investment is fees. In fact, the relationship between fees and performance is an inverse one. Every investor needs to count costs.
  6. Multiple studies establish what we should already know: a manager who has a significant ownership stake in his fund is much more likely to do well than one who doesn’t. Make sure to look for “skin in the game” from every money manager you use.
  7. Don’t be afraid to ask for and get help. American virologist David Baltimore, who won the Nobel Prize for Medicine in 1975, once told me that over the years (and especially while he was president of Caltech) he had received many manuscripts claiming to have solved some great scientific problem or overthrown the existing scientific paradigm to provide some grand theory of everything. Many prominent scientists have drawers full of similar submissions, usually from people working alone and outside the scientific community. As Dr. Baltimore emphasized, good science is a collaborative, community effort; crackpots work alone.

Happy New Year and all the best in 2016!

Source: TA


3-D View of the Yield Curve

  • March 19, 2015/
  • Posted By : admin/
  • 0 comments /
  • Under : Bonds, Economy, Market Outlook

Here’s an awesome graphic from the New York Times showing the yield curve in three dimensions (time, duration, yield).  The yield curve shows how much its costs the federal government to borrow money for a given amount of time, revealing the relationship between long- and short- term interest rates.

Visit the NYT website to continue the 3D exploration.

3d-yield-curve


Best Illustration of Bull & Bear Markets

  • January 22, 2015/
  • Posted By : admin/
  • 0 comments /
  • Under : Market Outlook, Performance

bull-bear-chartThis is the best illustration we’ve ever seen of history’s bull and bear markets.  Blue illustrates past bull markets’ durations and returns (total and annualized).  Red illustrates the bear markets.  This was published in May 2014 so the current bull market is actually pushing 69 months.

Some key takeaways:

  1. There’s a lot more blue than red meaning stocks tend to spend more time going up in value than going down.
  2. The current bull market might feel long but by historical standards, the length and strength of this bull is not exceptional

Source: BI


CNBC Core Viewership Drops to 20-Year Low — Why that’s a good thing!

  • August 29, 2013/
  • Posted By : admin/
  • 0 comments /
  • Under : Economy, Market Outlook, Scams & Schemes, Seeking Prudent Advice

Click to zoom

According to the latest Nielsen data, CNBC’s prime viewership (age 25-54 demographic) just tumbled to a fresh 20 year low of just 37,000, the lowest since March 1993. CNBC’s Fast Money (fell 32% vs previous year), Mad Money (fell 42% year-over-year) and Kudlow (fell 52% year-over-year) all had all time low ratings in the “all viewers” category in August 2013.

So why is this a good thing?

This is good news for individual investors and their advocates because it means less people are being negatively influenced by CNBC’s misinformation.

CNBC’s goal is not to make you money, but to sell advertising.They want you to live in fear and react to every little hiccup in the market so that you’re glued to their network in order to receive investment advice from their guests and anchors. But if you make just one move to improve your portfolio’s performance this year, it should be turning off CNBC. In fact, you should tune out most of the financial media. 

If you’re invested for the long haul, it really doesn’t matter…

  • If inflation is up two-tenths of a percentage point this year,
  • Or if the Consumer Confidence Index dips 3%,
  • Or if the Bull Bear Sentiment Indicator switches from bullish to bearish.

Your portfolio should be positioned to withstand good times and bad. You shouldn’t be jumping in and out of the market or sectors based on news, politics, the economy, or any other event.


Annual Returns by Asset Class

  • August 8, 2013/
  • Posted By : admin/
  • 0 comments /
  • Under : Market Outlook, Performance

These charts show how different asset classes rank each year over the past 10 years (best performers on top).  This is an excellent demonstration of how hard it is to predict the future and how often the least-popular investments outperform common expectations.

Click to enlarge

Click to enlarge

Source: J.P. Morgan


12345
Recent Posts
  • What the Fed sees…and why it matters September 2,2025
  • New Tax Law: 7 Big Changes You Should Know About August 1,2025
  • Markets at All-Time Highs: What Should You Do Now? July 1,2025
  • Thoughts on the shifting housing market June 5,2025
  • The patience premium: What market history teaches us May 1,2025
Archives
  • September 2025
  • August 2025
  • July 2025
  • June 2025
  • May 2025
  • April 2025
  • March 2025
  • February 2025
  • January 2025
  • December 2024
  • November 2024
  • October 2024
  • September 2024
  • August 2024
  • July 2024
  • June 2024
  • May 2024
  • April 2024
  • March 2024
  • February 2024
  • January 2024
  • December 2023
  • November 2023
  • October 2023
  • September 2023
  • August 2023
  • June 2023
  • May 2023
  • April 2023
  • March 2023
  • February 2023
  • January 2023
  • November 2022
  • October 2022
  • September 2022
  • August 2022
  • July 2022
  • May 2022
  • April 2022
  • March 2022
  • February 2022
  • December 2021
  • October 2021
  • September 2021
  • August 2021
  • July 2021
  • June 2021
  • May 2021
  • April 2021
  • March 2021
  • February 2021
  • January 2021
  • December 2020
  • November 2020
  • October 2020
  • September 2020
  • August 2020
  • July 2020
  • June 2020
  • May 2020
  • April 2020
  • March 2020
  • November 2019
  • October 2019
  • June 2019
  • May 2019
  • April 2019
  • March 2019
  • February 2019
  • January 2019
  • December 2018
  • November 2018
  • October 2018
  • September 2018
  • August 2018
  • July 2018
  • June 2018
  • May 2018
  • April 2018
  • March 2018
  • February 2018
  • January 2018
  • December 2017
  • November 2017
  • October 2017
  • September 2017
  • August 2017
  • July 2017
  • June 2017
  • May 2017
  • April 2017
  • March 2017
  • February 2017
  • January 2017
  • December 2016
  • November 2016
  • October 2016
  • September 2016
  • August 2016
  • July 2016
  • June 2016
  • May 2016
  • April 2016
  • March 2016
  • February 2016
  • January 2016
  • December 2015
  • November 2015
  • October 2015
  • September 2015
  • August 2015
  • July 2015
  • June 2015
  • May 2015
  • April 2015
  • March 2015
  • February 2015
  • January 2015
  • December 2014
  • November 2014
  • October 2014
  • September 2014
  • August 2014
  • July 2014
  • June 2014
  • May 2014
  • April 2014
  • March 2014
  • February 2014
  • January 2014
  • December 2013
  • November 2013
  • October 2013
  • September 2013
  • August 2013
  • July 2013
  • June 2013
  • May 2013
  • April 2013
  • March 2013
  • February 2013
  • January 2013
  • December 2012
  • November 2012
  • October 2012
  • September 2012
  • August 2012
  • July 2012
  • June 2012
  • May 2012
  • April 2012
  • March 2012
  • February 2012
  • January 2012
  • December 2011
  • November 2011
  • October 2011
  • September 2011
  • August 2011
  • July 2011
  • June 2011
  • May 2011
  • April 2011
  • March 2011
  • February 2011
  • January 2011
  • November 2010
  • October 2010
  • September 2010
  • August 2010
Categories
  • 401(k)
  • Annuities
  • Behavior
  • Best Practices
  • Bonds
  • Charitable Donations
  • Economy
  • Fees
  • Fiduciary
  • Financial Planning
  • Investing 101
  • Live Well
  • Market Outlook
  • Mutual Funds
  • NorthStar
  • Performance
  • Personal Finance
  • Planning
  • Retirement
  • Saving Money
  • Scams & Schemes
  • Seeking Prudent Advice
  • Tax Planning
  • Uncategorised
  • Uncategorized
  • Weekly Market Review
ABOUT US

We are a fee-only, independent fiduciary advisor. Our allegiance rests solely with our clients and their best interests. We are headquartered in Charlotte, North Carolina and serve client families across the nation.


CLIENT TOOLS
CONTACT
  • (704) 350-5028
  • info@nstarcapital.com
  • 521 East Blvd, Charlotte, NC 28203
    (by appointment only)
  • fax: (704) 626-3462
FROM OUR BLOG
  • What the Fed sees…and why it matters September 2,2025
  • New Tax Law: 7 Big Changes You Should Know About August 1,2025
  • Markets at All-Time Highs: What Should You Do Now? July 1,2025
Nothing on this website constitutes either the provision of investment advice or solicitation to provide investment advice.
Investment advice can only be provided through a formal investment advisory relationship.