Bull market confirmed! What happens next
It’s official. The bear market is behind us.
The S&P 500 finally hit a new record for the first time since 2022. And then notched multiple higher highs in the days that followed.1
That means it has passed the final bar to formalize the bull market in stocks that started after the October 2022 market low.2
What’s a bull market?
Though there’s no official designation, “bull market” is a handy nickname for a period of generally rising markets.
Bull markets get called when a) markets rise at least 20% above the most recent market bottom and b) reach and surpass the previous market high.
It can get a bit confusing since sometimes we’re in a bull market but don’t “officially” call it until later.
Let’s take a moment to celebrate a milestone.
(I’ll wait.)
Does this mean all stocks are rising?
No. An index like the S&P 500 represents a portion of the market and is useful for tracking trends over time.
The performance of individual stocks is affected by the earnings and expectations of the underlying companies and other factors that may not apply to the overall market.
So, what happens next?
If we look at the history of bull markets, we can expect markets to continue to rise.
The last two bull markets (from 2009-2020 and 2020-2022) lasted 132 months and 21 months, respectively.3
On the other hand, there are reasons to be cautious.
For one, the past doesn’t predict the future.
Pullbacks happen regularly and it’s common to see a drop after pushing new highs as investors take profits.
And we know investor optimism can flip to negativity quickly when fresh headlines arrive.
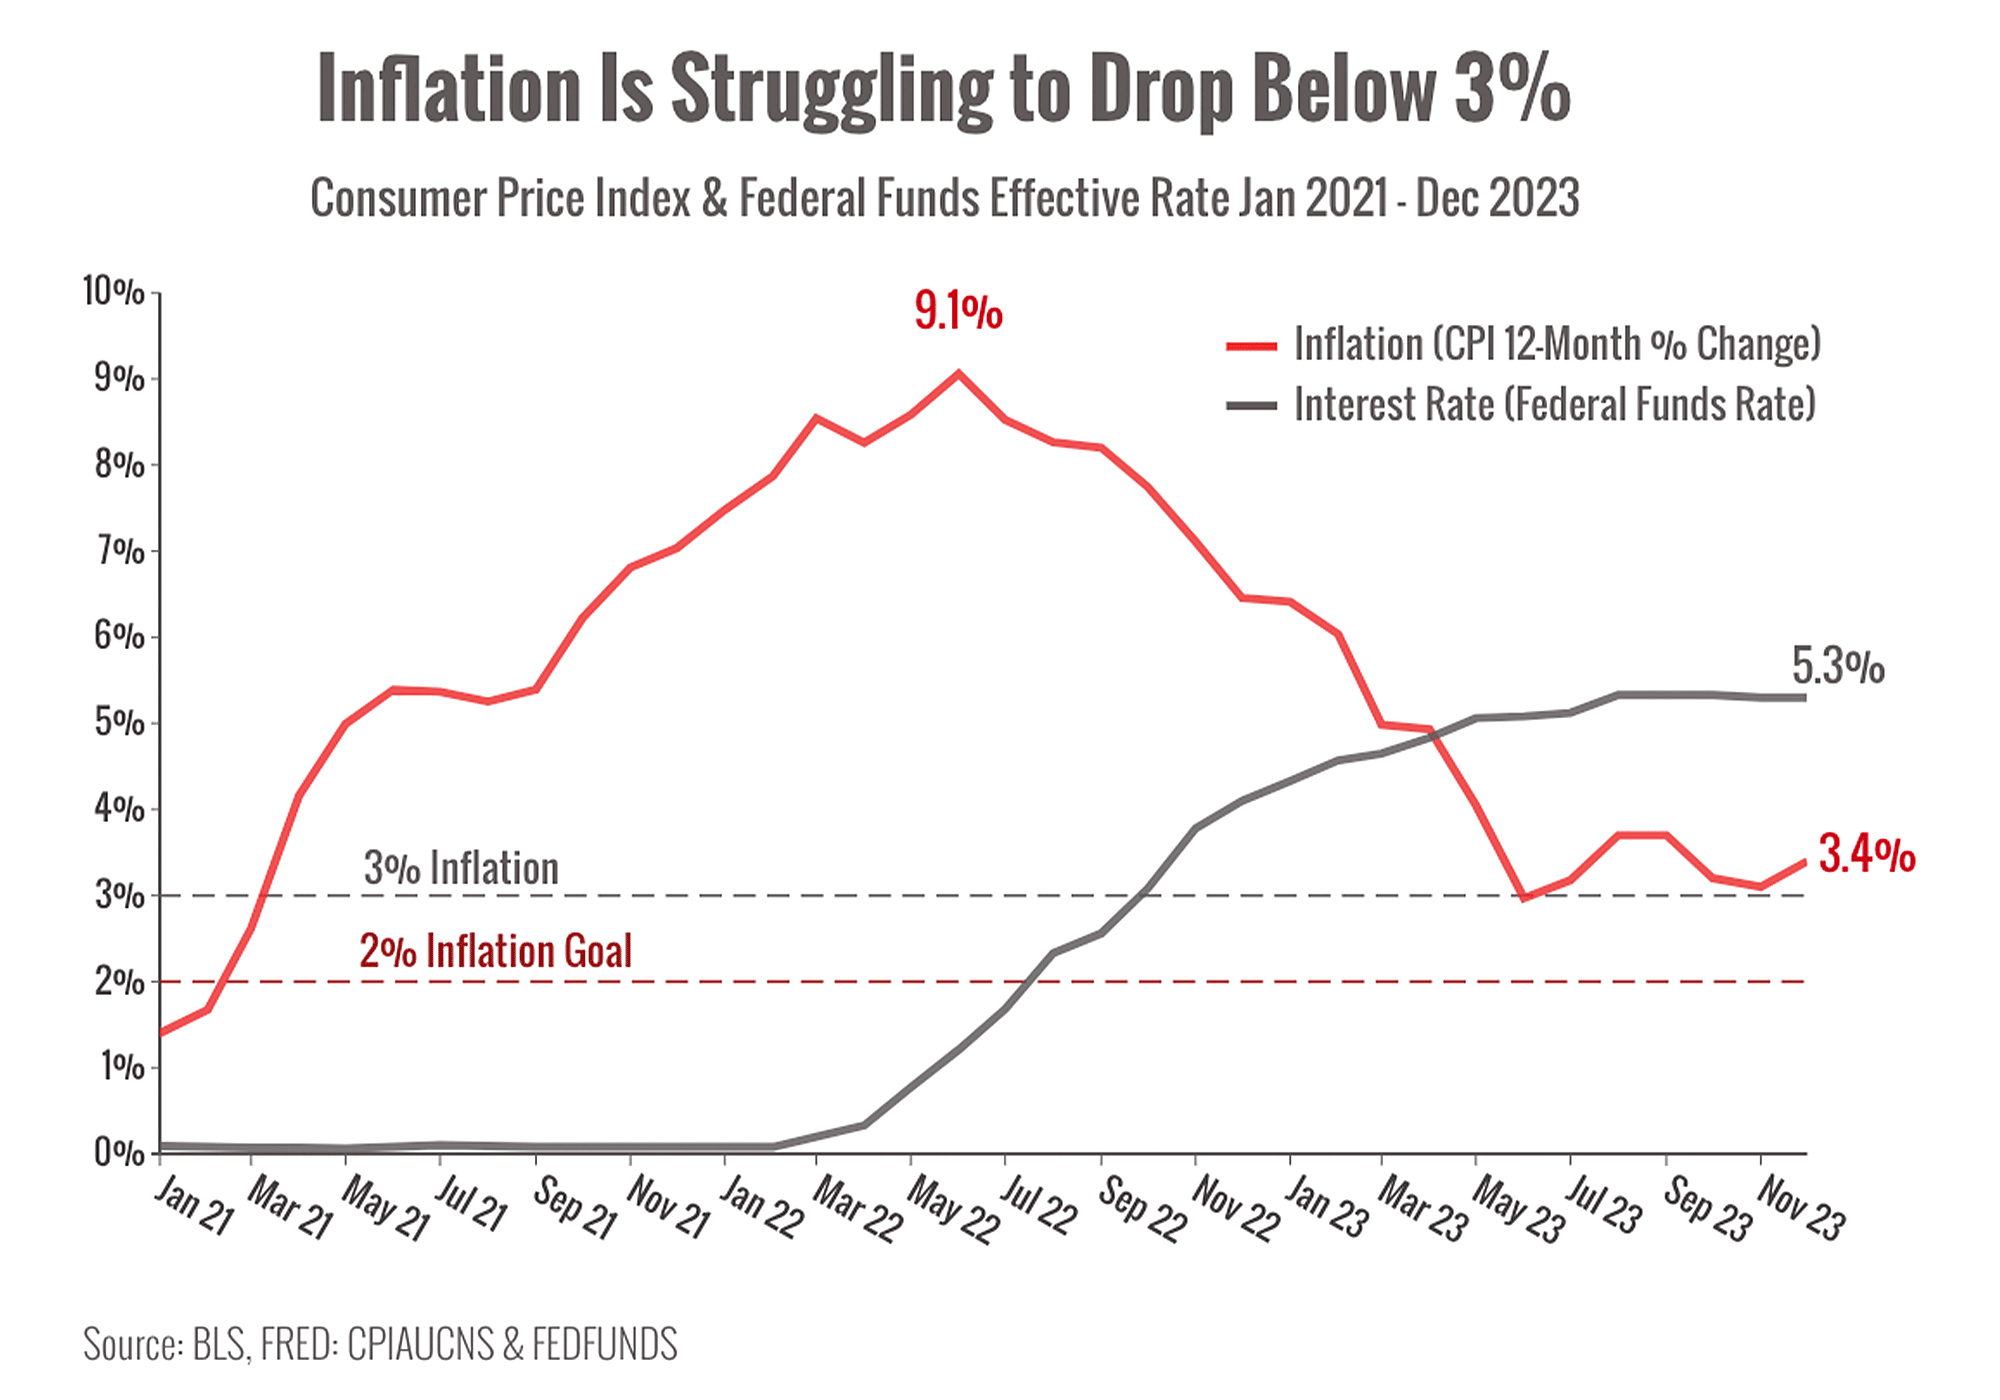
The year has kicked off with lingering uncertainties about inflation, interest rates, and the economy that could drag on market performance.4
Here’s a chart that shows intra-year dips in the S&P 500 alongside annual performance.
(Take a look at the red circles to see the market drops each year.)
The big takeaway? In 16 of the last 24 years, markets have dropped at least 10%.5
Even in years with powerful performance, markets typically experience a pullback or two.
For right now, we have some excellent economic news to celebrate.
The economy grew much faster than expected at the end of 2023.
The U.S. economy grew 3.3% (annualized) in the fourth quarter—much higher than the 2% expected—though still slowing from 4.9% growth in Q3.6
Consumer spending was strong, indicating Americans are feeling optimistic enough to keep shopping.
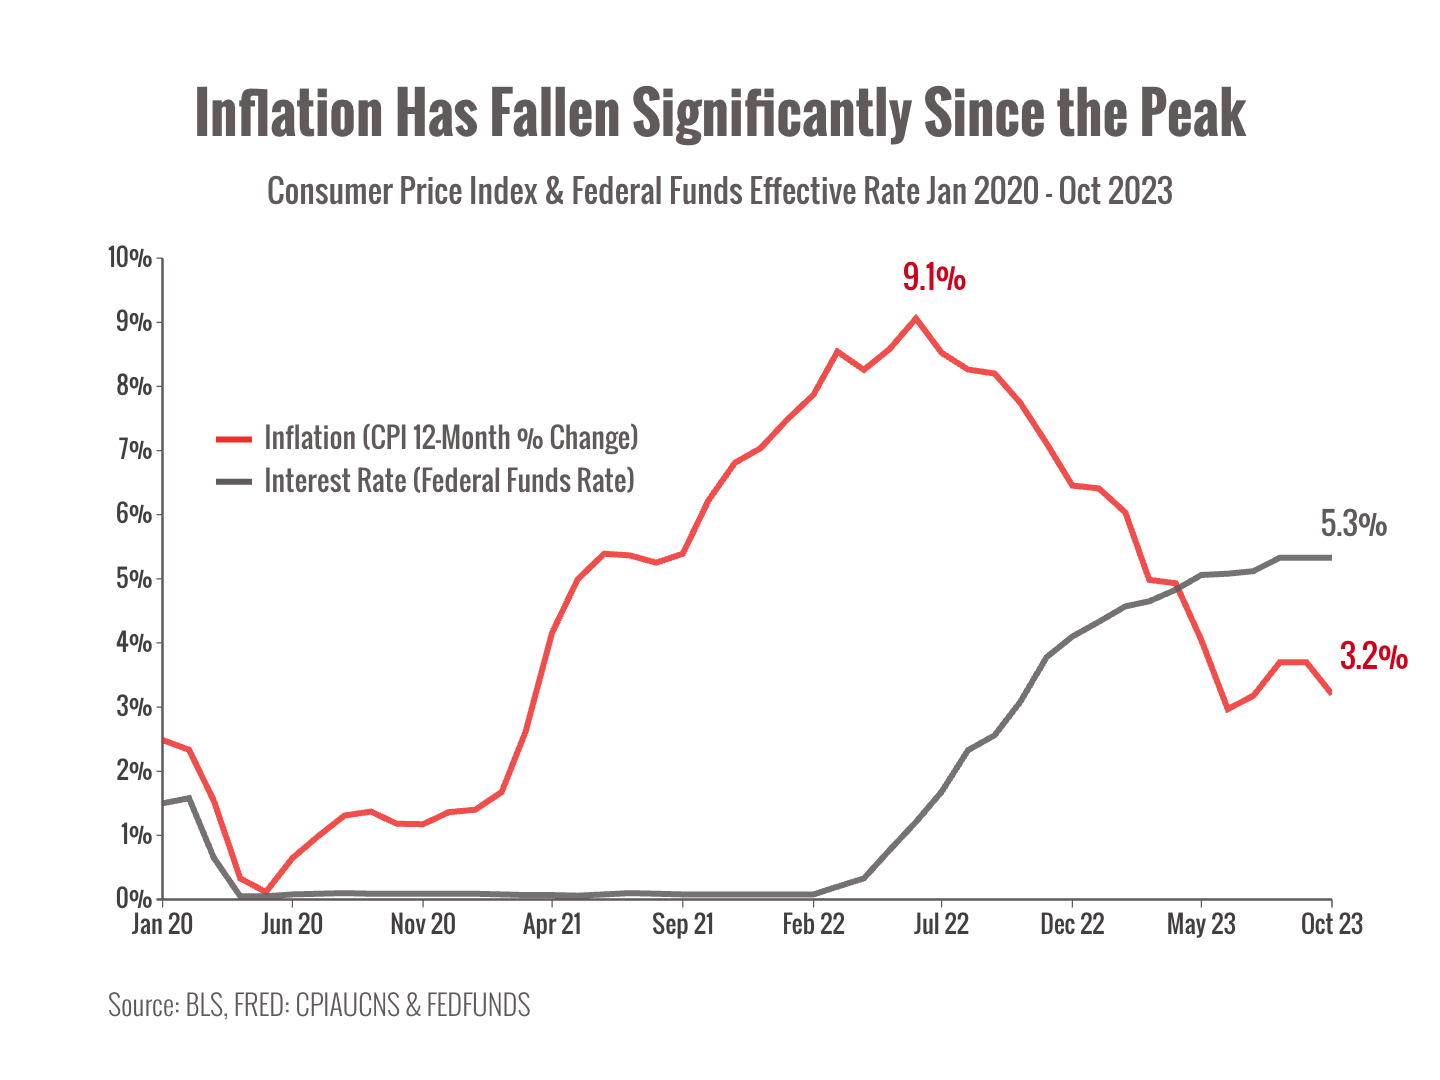
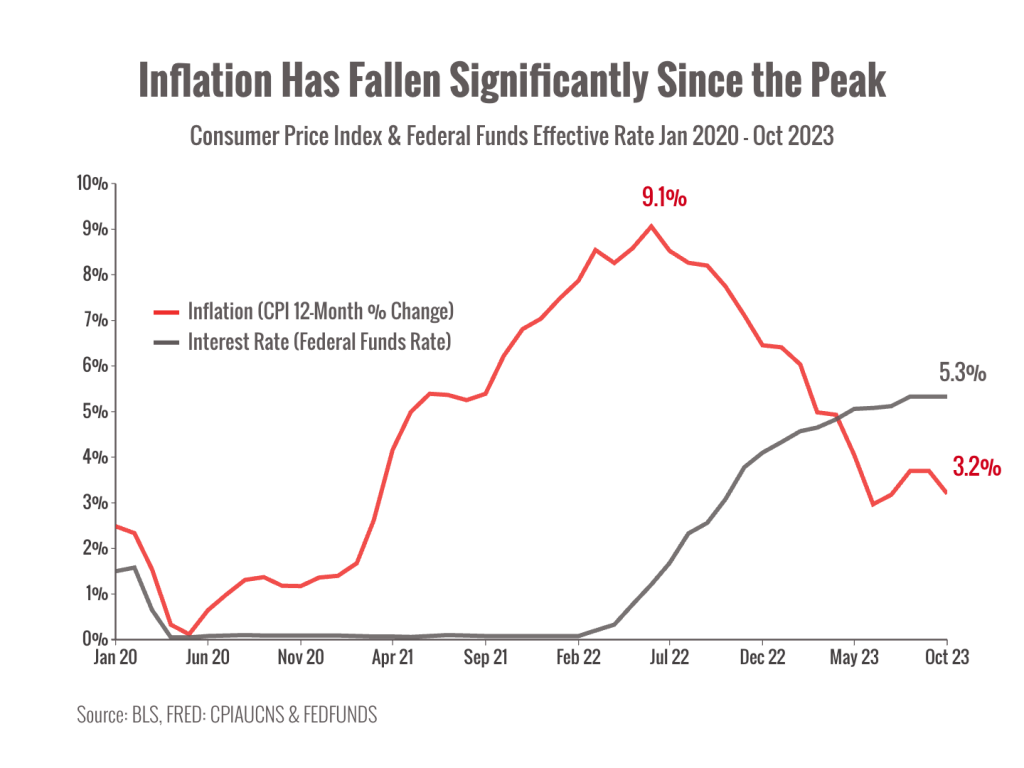
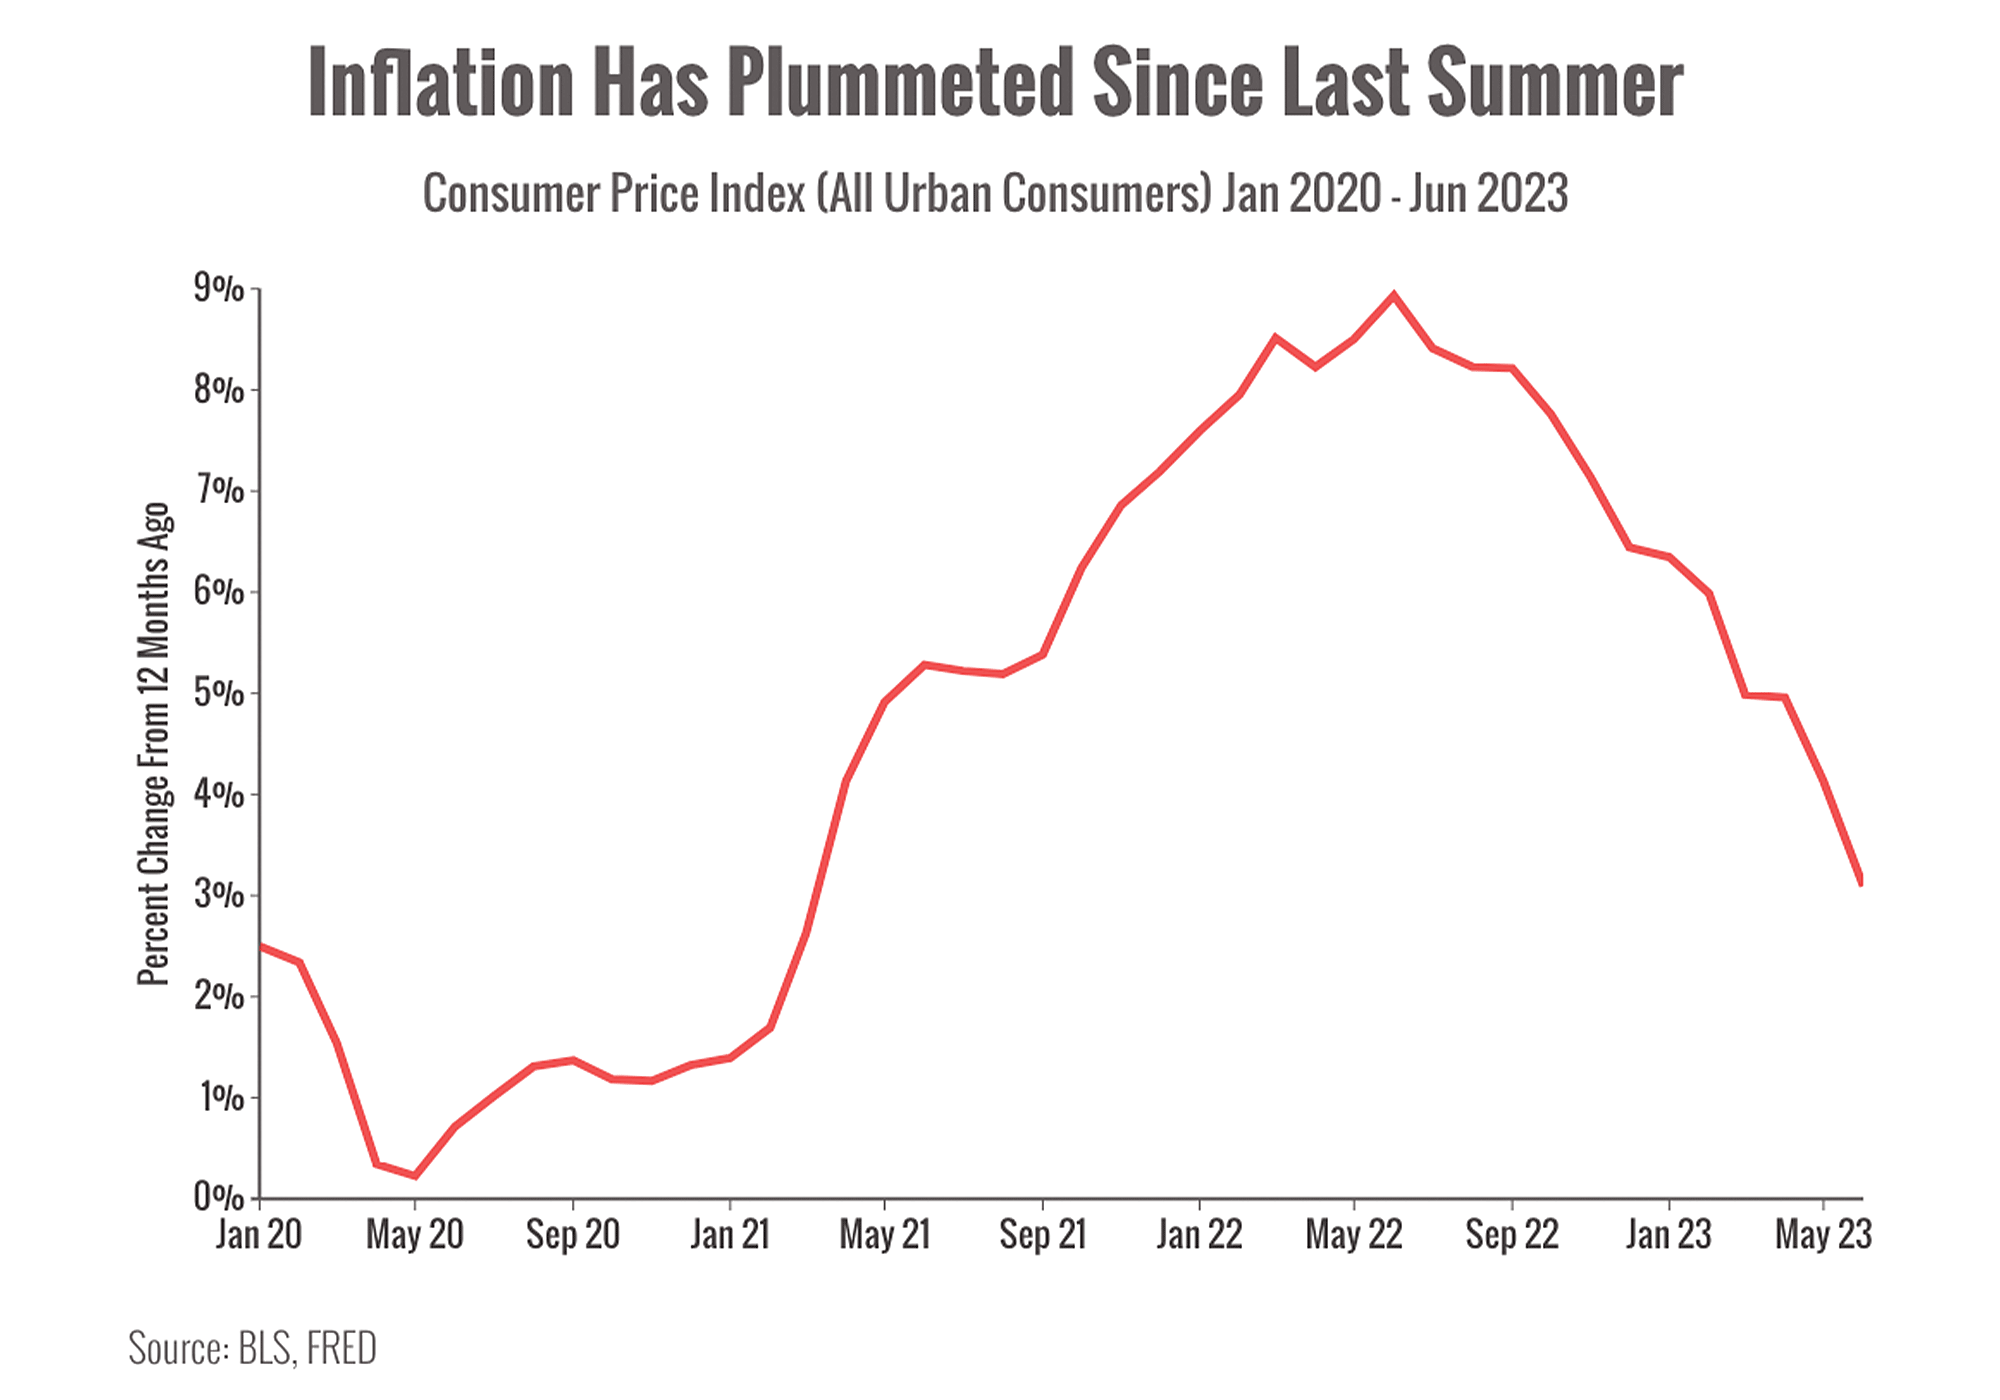
There’s also encouraging data on inflation.
The Personal Consumption Expenditures (PCE) index shows inflation rose just 2.7% in 2023 overall, down from 5.9% a year ago. That’s a significant decrease in overall inflation.6
Taken together, that means the economy is still growing while inflation continues to moderate, which is exactly what economists hoped would happen.
Bottom line: we’re seeing positive developments but remaining cautious. We’re keeping an eye on markets and will be in touch with updates as needed.
Sources:
2. https://www.nytimes.com/2024/01/19/business/stocks-bull-market.html
3. https://www.forbes.com/advisor/investing/bull-market-history/
4. https://www.morganstanley.com/ideas/are-we-in-a-bull-market-2024
6. https://www.cnbc.com/2024/01/24/stock-market-today-live-updates.html


 Losing a job can feel devastating (especially when you didn’t see it coming).